
Shiba Inu (SHIB) is in a crucial make-or-break moment. Following a market-wide altcoin slump, SHIB’s price action is being shaped by two opposing chart patterns, both of which could have significant implications for the price’s future.
A Tale Of Two Patterns For Shiba Inu
The 1-week chart for SHIB reveals a tale of two patterns. On one hand, there’s the bullish triple bottom, suggesting a potential end to SHIB’s two-year downtrend. On the other, a descending triangle, which has been in the making for over 13 months, hints at a bearish outcome. In an analysis on August 30, NewsBTC already warned of this scenario.
Yesterday, SHIB’s price dipped to a low of $0.00000697 before rebounding slightly to $0.00000722. This places it precariously above the crucial support line of $0.00000715. For SHIB to steer clear of the bearish implications of the descending triangle and to validate the triple bottom, it’s imperative that it maintains a weekly close above this price.
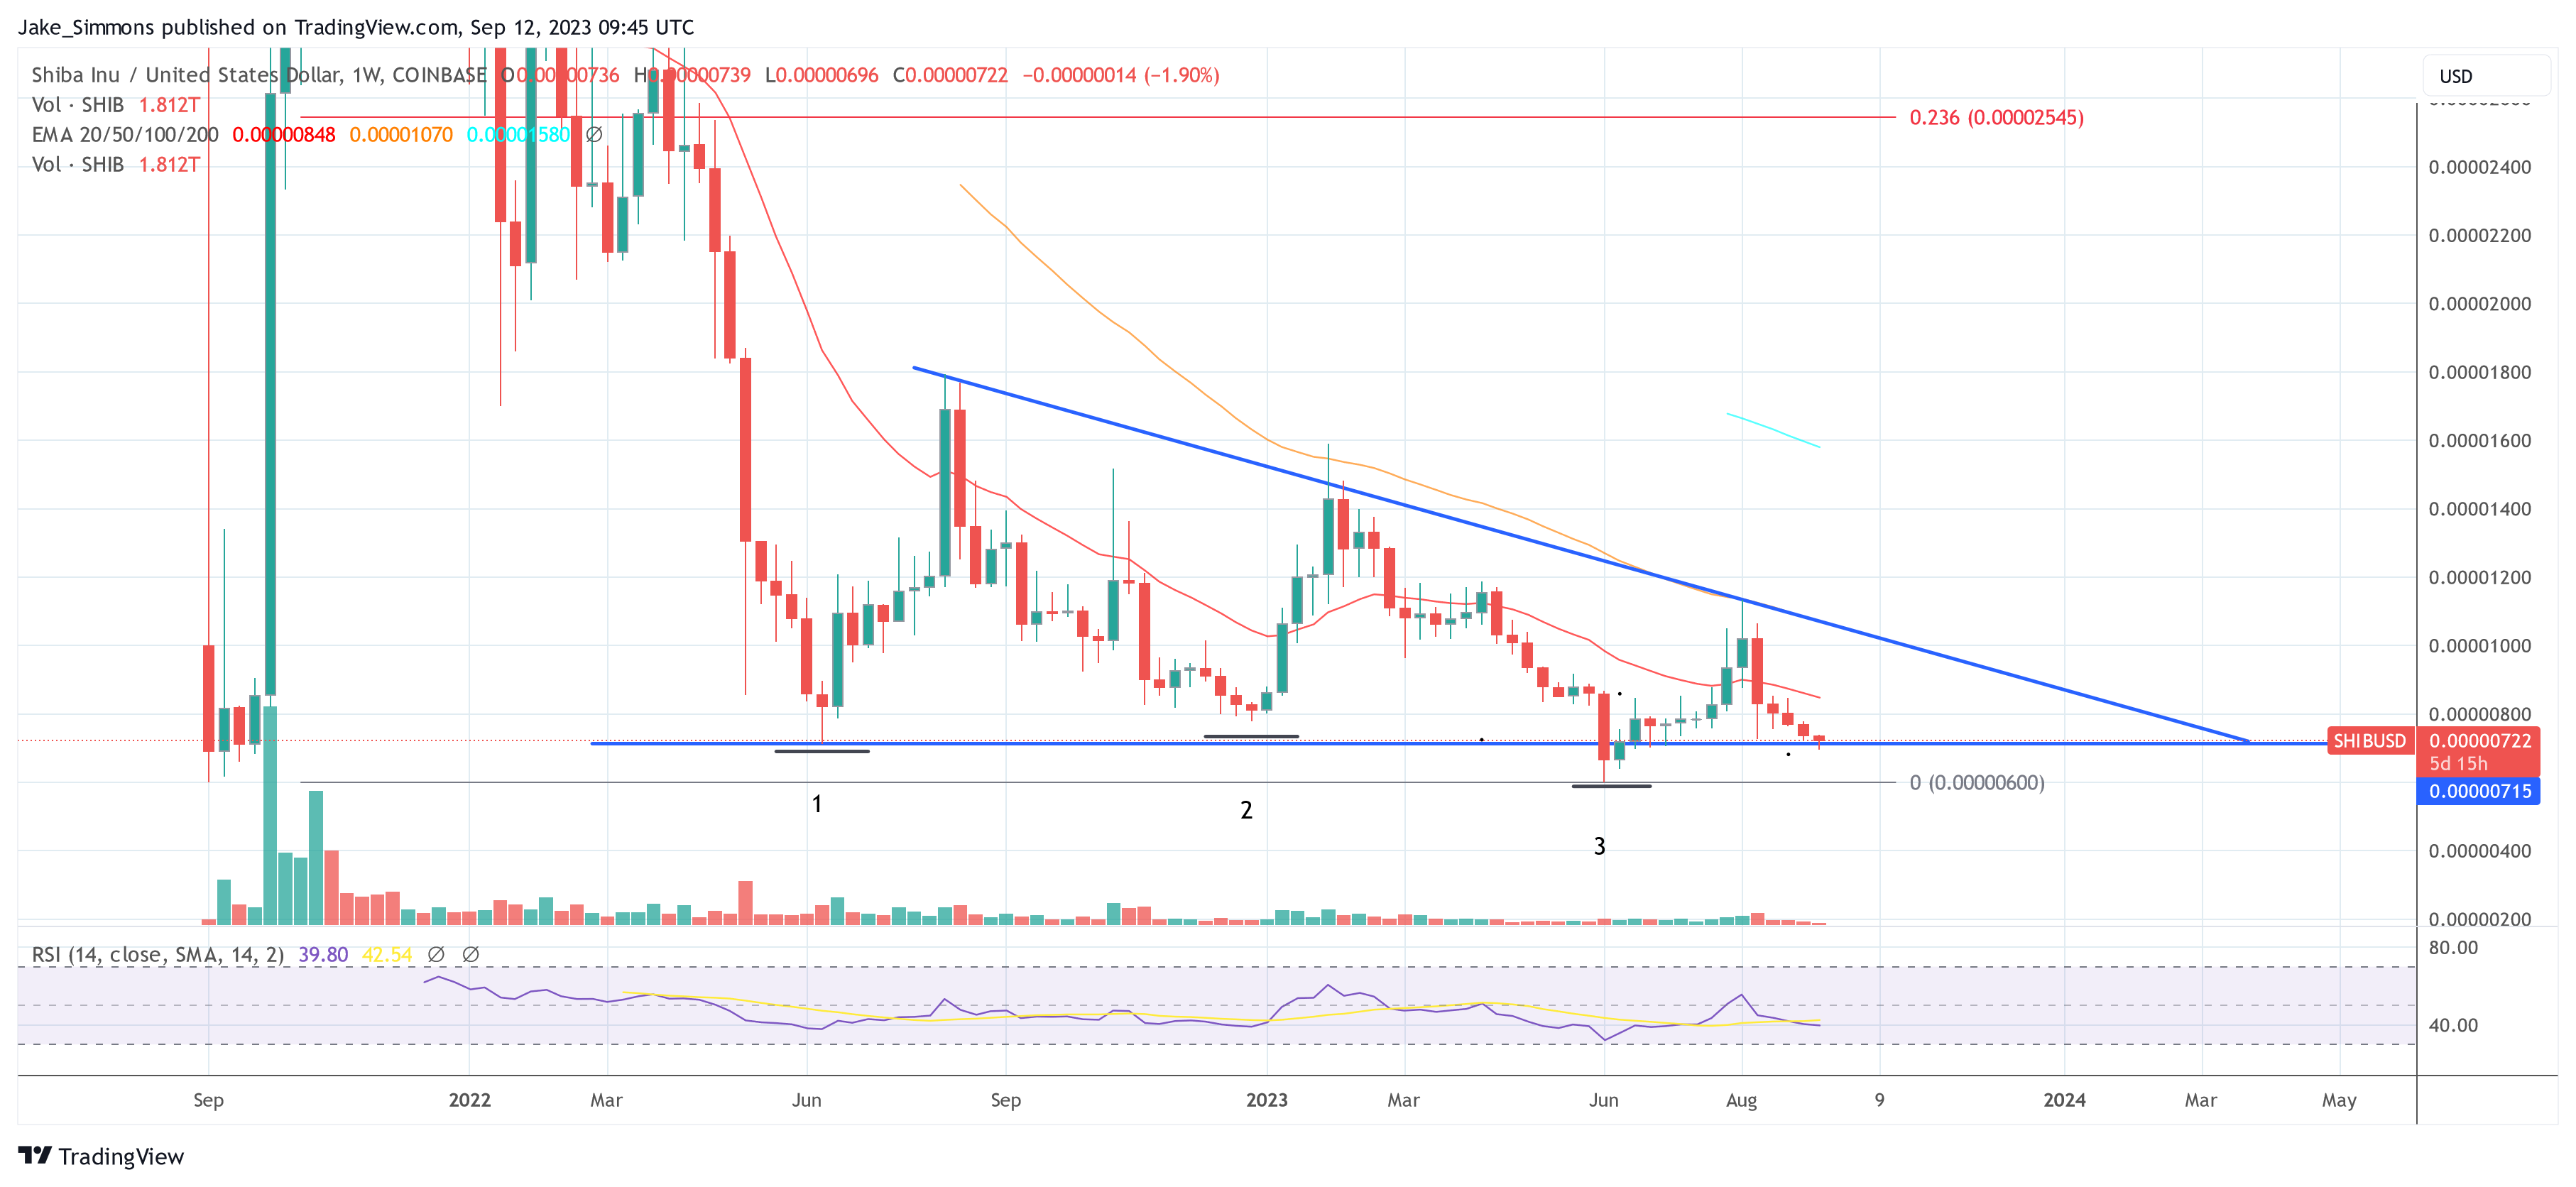
The triple bottom, a bullish chart pattern, is characterized by three roughly equivalent lows bouncing off a support level, culminating in a breakout above resistance. This suggests a shift in momentum from sellers to buyers. For SHIB, the criteria for a triple bottom seem to be in place: an existing downward trend precedes the pattern; the three lows are approximately equal, allowing for a horizontal trend line and a decline in volume throughout the pattern suggests weakening bearish momentum.
SHIB’s journey through this pattern began in June 2022 with its first low at $0.00000715. After a brief recovery, it hit its second low in December 2021 at $0.00000781. The third and most recent low was recorded in June 2023 at $0.0000060.
The Shadow Of The Descending Triangle
However, the triple bottom’s bullish narrative is challenged by the descending triangle’s bearish undertones. If SHIB’s price falls below the $0.00000715 support, it could validate the descending triangle, potentially pushing SHIB towards its year-to-date low of $0.000006. A breach of this level might plunge SHIB into uncharted waters, making a new all-time low a grim possibility.
Traders often seek additional confirmation of patterns through other technical indicators. The Relative Strength Index (RSI) is one such tool. SHIB’s weekly RSI currently stands at a neutral 39.8 (neutral). However, a recent dip below the 30-mark (indicating oversold conditions) suggests that the recent price drop might have been the last for SHIB.
Should the triple bottom be validated, SHIB could witness a significant rally. An immediate target to watch would be the 23.6% Fibonacci retracement level at $0.00002545, translating to a potential surge of approximately 250% from its current price.
In conclusion, SHIB’s future hangs in the balance. The coming days and weeks will be crucial in determining whether it embarks on a bullish rally or succumbs to bearish pressures.
Source: Read Full Article
-
Binance says decision to pull Abu Dhabi licensing bid unrelated to US settlement
-
Ripple CTO clarifies on SEC appeal, highlights case complexity
-
Music with AI elements can win a Grammy, Recording Academy CEO says in report
-
Ethereum Price Maze: Will It Soar To $2,000 Or Stay At $1,500?
-
Yearn.finance pleads arb traders to return funds after $1.4M multisig mishap