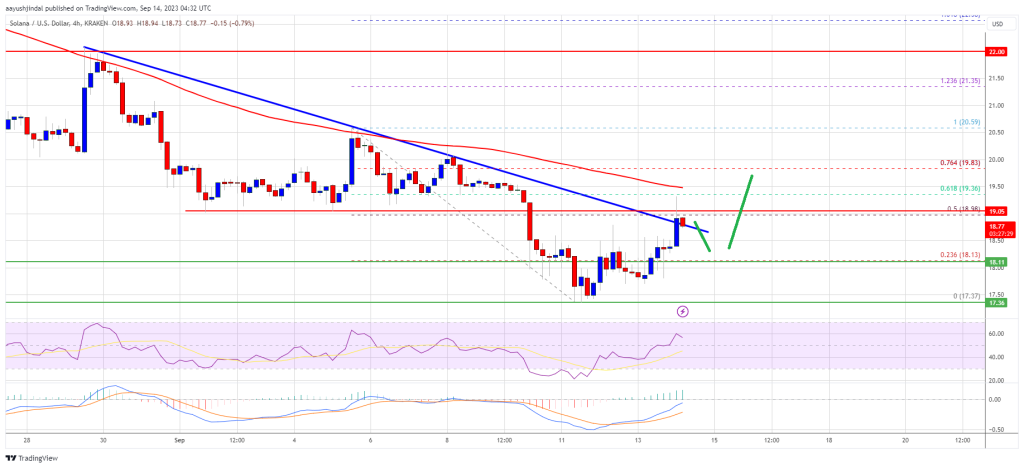
Solana is eyeing a fresh increase above the $19.00 resistance against the US Dollar. SOL price must settle above $19 and $20 to start a fresh increase.
- SOL price is attempting a bullish breakout above the $19 resistance against the US Dollar.
- The price is now trading below $20 and the 100 simple moving average (4 hours).
- There is a major bearish trend line forming with resistance near $18.80 on the 4-hour chart of the SOL/USD pair (data source from Kraken).
- The pair could gain bullish momentum if it settles above the trend line and $20.
Solana Price Eyes Bullish Breakout
In the past few days, Solana’s price extended its decline below the $22 support. SOL even traded below the $20 level to move further into a bearish zone.
Finally, it tested the $17.40 zone. A low was formed near $17.37 and the price is now attempting a fresh increase, like Bitcoin and Ethereum. There was a move above the $18.50 resistance zone. The price even spiked above the 50% Fib retracement level of the downward move from the $20.60 swing high to the $17.37 low.
However, the bears are protecting a close above the $19 resistance. There is also a major bearish trend line forming with resistance near $18.80 on the 4-hour chart of the SOL/USD pair.
Solana is now trading below $20 and the 100 simple moving average (4 hours). On the upside, immediate resistance is near the $19.00 level. The first major resistance is near the $19.40 level or the 100 simple moving average (4 hours). It is close to the 61.8% Fib retracement level of the downward move from the $20.60 swing high to the $17.37 low.
Source: SOLUSD on TradingView.com
The next key resistance is near $20. A clear move above the $20 resistance might send the price toward the $21.20 resistance. Any more gains might send the price toward the $22 level.
Another Decline in SOL?
If SOL fails to settle above $19.00 and $19.40, it could start another decline. Initial support on the downside is near the $18.10 level.
The first major support is near the $17.40 level. If there is a close below the $17.40 support, the price could decline toward the $16.50 support. In the stated case, there is a risk of more downsides toward the $15.00 support in the near term.
Technical Indicators
4-Hours MACD – The MACD for SOL/USD is gaining pace in the bullish zone.
4-Hours RSI (Relative Strength Index) – The RSI for SOL/USD is above the 50 level.
Major Support Levels – $18.10, and $17.40.
Major Resistance Levels – $19.00, $19.40, and $20.00.
Source: Read Full Article
-
Weekly Cryptocurrency Market Analysis: Altcoins Hold Their Recent Levels And Continue Their Upward Trend
-
Elon Musk threatens Microsoft with suit, claims AI trained on Twitter data
-
Former Binance.US CEO joins Hashdex board
-
Absorb for adoption — How infamous 30% Apple cut affects iOS NFT apps
-
Kraken's Warning Bells as Solana (SOL) Faces FTX Liquidation Threat – Coinpedia Fintech News


