
The MATIC price recovery has faced a hurdle in recent trading sessions, despite its impressive rebound after surpassing the $0.50 level. Although the altcoin experienced a notable 18% appreciation on the weekly chart, it lost 3% of its market value within the past 24 hours.
The overall sentiment remains bearish as demand and accumulation for MATIC have remained low. While buying strength attempted to recover, it has not fully aligned with investor expectations.

To reignite demand in the market, the altcoin must overcome immediate resistance levels. Surpassing these resistance levels will be key for the altcoin to rally and overcome significant barriers. The decline in MATIC market capitalization indicates a decrease in buying strength.
Related Reading: Breaking Through This Ceiling Will Propel XRP By Another 12%
MATIC Price Analysis: One-Day Chart
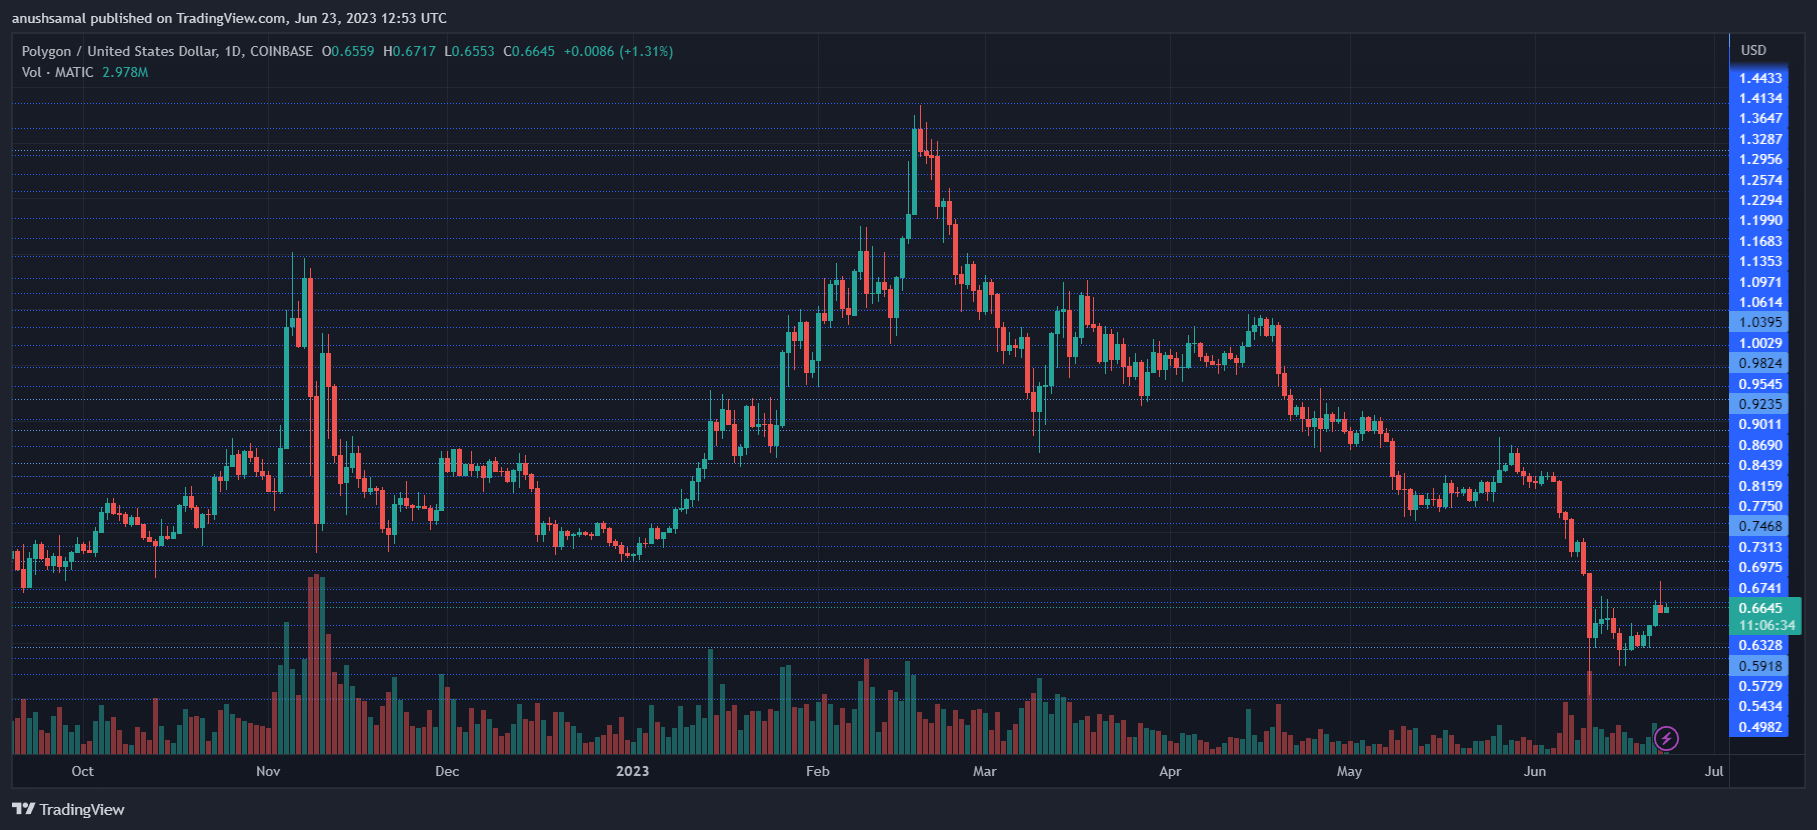
At the time of writing, MATIC was valued at $0.66. The coin faced resistance at $0.68, but surpassing this level could potentially drive the price toward $0.73. With further potential MATIC may reach $0.77. However, breaching the $0.73 resistance is expected to be challenging for MATIC.
Conversely, if buyers fail to emerge in the upcoming trading sessions, the coin may continue to decline. MATIC may move towards its local support level of $0.59, and with a further push downward, the altcoin may trade near $0.57.
The recent session’s trading volume for MATIC also decreased, indicating that sellers had control over the price. This joins in to paint a very bearish outlook for the coin.
Technical Analysis
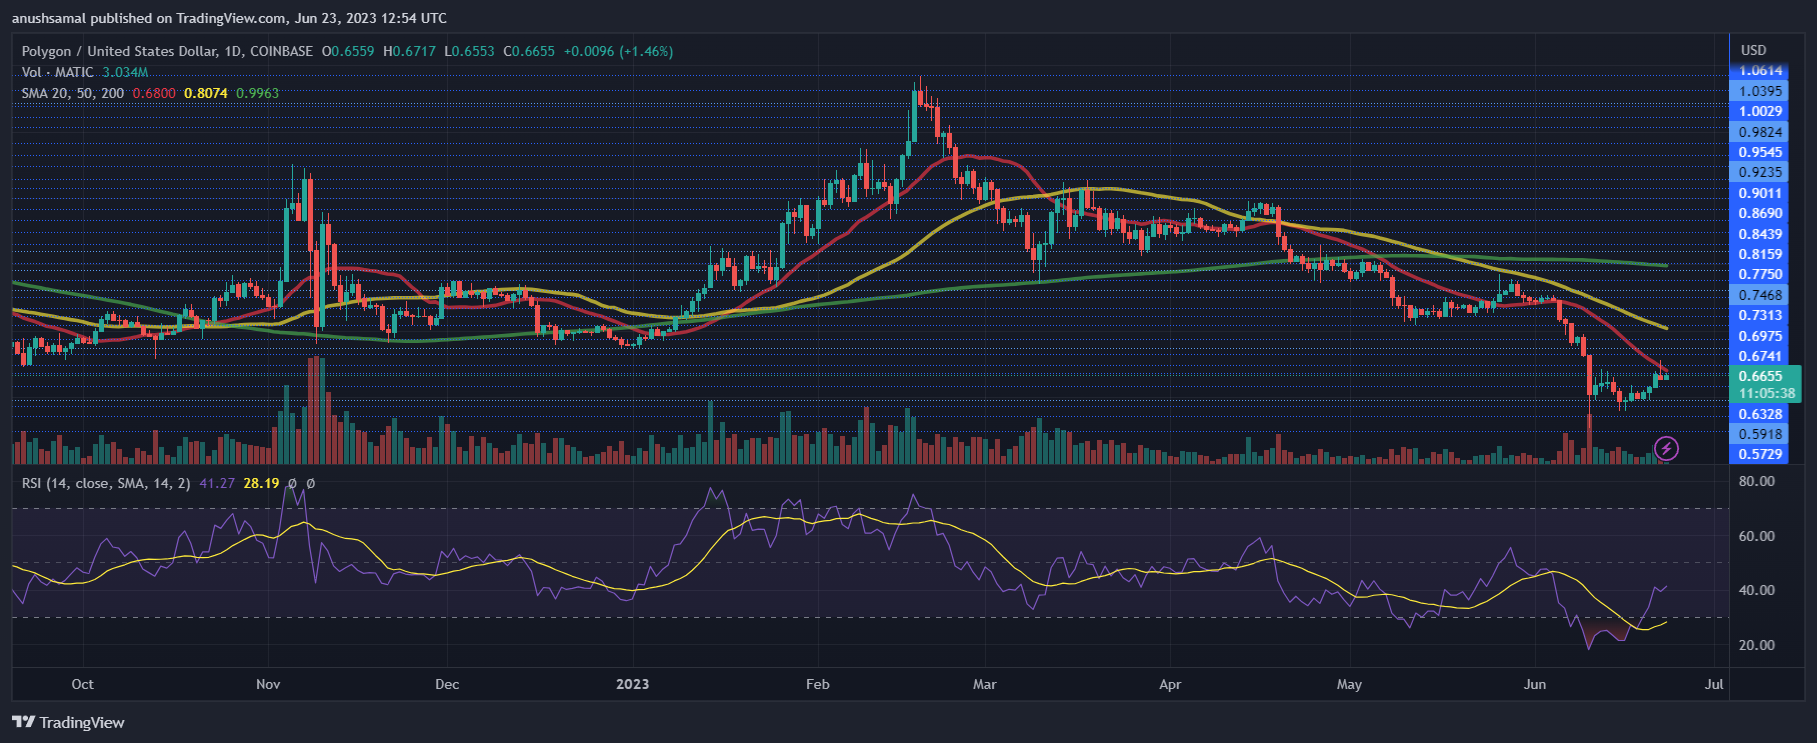
Despite a slight recovery in buying strength, the altcoin’s uptick may not be sustained unless it moves above the $0.68 level. The Relative Strength Index (RSI) experienced a marginal increase but remained below the half-line, indicating a prevailing dominance of selling pressure.
Additionally, the asset’s price fell below the 20-Simple Moving Average (SMA) line, reflecting weak demand and suggesting that sellers are currently driving the market’s price momentum.
Positive signs are, however, emerging for MATIC on its daily chart, indicating a potential bullish trend. The formation of buy signals suggests an increase in buying interest, but for this trend to be sustained, continued growth in demand is necessary.
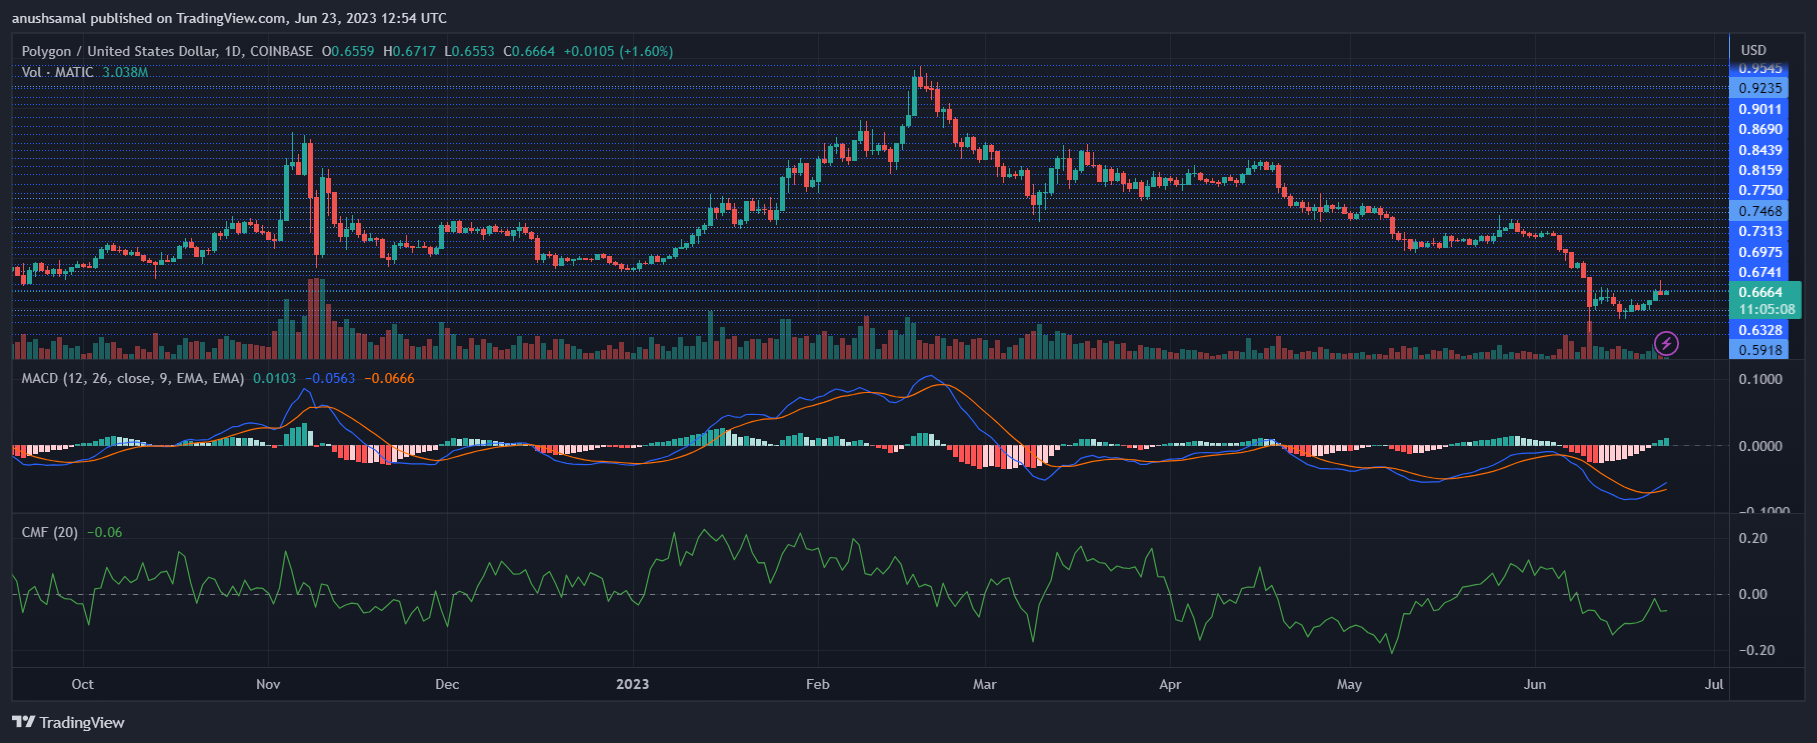
The Moving Average Convergence Divergence (MACD), which tracks price momentum and reversals, has shown green histograms tied to buy signals on the chart. However, the Chaikin Money Flow indicator remains below the half-line, indicating a lower inflow of capital compared to the outflow.
With consistent growth in demand though, even if by slow buildup, the altcoin has the potential to overcome immediate hurdles and achieve further gains. However, if the price remains at its current level, there is a possibility of another dip.
Source: Read Full Article
-
Deloitte, Chainalysis alliance to give law enforcement a crypto edge
-
Cryptos Brace for More Enforcement Actions as SEC Seeks $2B Funding to Tame ‘Misconduct’
-
Wife finds husband’s Bitcoin stash amid divorce proceedings
-
‘Everything’s on sale’: Reddit founder, Galaxy and Genesis execs raise big money
-
Shiba Inu Is In A Limited Span And Is On The Verge Of An Upswing Or Collapse