
Ethereum price gained bearish momentum below $1,620 against the US Dollar. ETH is showing bearish signs and might decline further toward $1,540.
- Ethereum declined further below the $1,600 support zone.
- The price is trading below $1,620 and the 100-hourly Simple Moving Average.
- There are two bearish trend lines forming with resistance near $1,600 and $1,620 on the hourly chart of ETH/USD (data feed via Kraken).
- The pair could continue to move down and test the $1,540 support in the short term.
Ethereum Price Takes Hit
Ethereum’s price started a fresh decline from the $1,660 and $1,670 resistance levels. ETH declined below the $1,620 support level to enter a bearish zone and underperformed Bitcoin.
The bears even pushed the price below the $1,600 support and the 100-hourly Simple Moving Average. A low is formed near $1,568 and the price is now attempting a recovery wave. There was a move above the $1,580 level. The price is testing the 23.6% Fib retracement level of the recent decline from the $1,660 swing high to the $1,568 low.
Ether is now trading below $1,620 and the 100-hourly Simple Moving Average. There are also two bearish trend lines forming with resistance near $1,600 and $1,620 on the hourly chart of ETH/USD.
On the upside, the price might face resistance near the $1,600 level and the first trend line. The next resistance is near the $1,610 level, the second trend line, and the 100-hourly Simple Moving Average. The trend line is also near the 50% Fib retracement level of the recent decline from the $1,660 swing high to the $1,568 low.
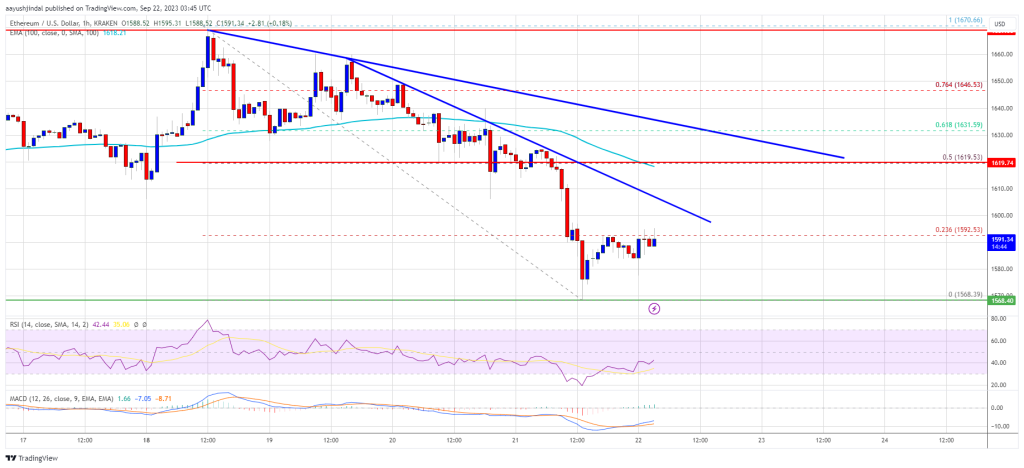
Source: ETHUSD on TradingView.com
A close above the $1,620 resistance might send the price toward the $1,650 resistance. The next major barrier is near the $1,660 level. A close above the $1,660 level might send Ethereum further higher toward $1,750.
More Losses in ETH?
If Ethereum fails to clear the $1,620 resistance, it could start another decline. Initial support on the downside is near the $1,565 level.
The next key support is $1,540. A downside break below $1,540 might accelerate losses. In the stated case, there could be a drop toward the $1,440 level in the coming days.
Technical Indicators
Hourly MACD – The MACD for ETH/USD is losing momentum in the bearish zone.
Hourly RSI – The RSI for ETH/USD is now below the 50 level.
Major Support Level – $1,540
Major Resistance Level – $1,620
Source: Read Full Article
-
Nigerian central bank adds NFC upgrade to eNaira for contactless payments
-
Ethereum Monthly Burn Surpasses 146,000 ETH As Total Clears $6.5 Billion
-
Will Blackrock Explore ETFs for Chainlink, Solana, and Dogecoin? Expert Answers – Coinpedia Fintech News
-
Cocoa broker testifies to Bitcoin holdings on FTX in Sam Bankman-Fried trial
-
Binance says ‘no comment’ on report it mulled closing US arm to protect its global firm