
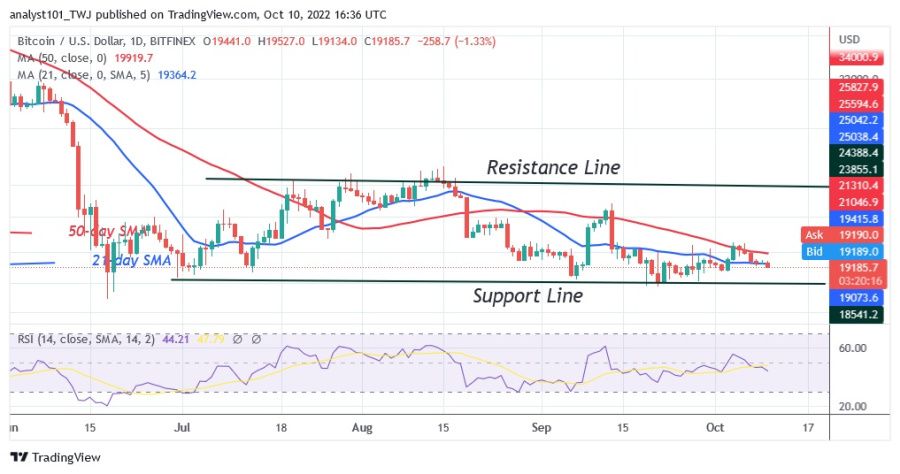
Bitcoin (BTC) price is in a downtrend, falling to the low of $19,136, but is pulled back. Sellers have undercut the moving average lines to lower the cryptocurrency value.
Bitcoin Price Long Term Forecast: Bearish
On October 4, buyers were rejected as they failed to keep the price above the moving average lines. The current selling pressure could continue if the price falls below the moving average lines. The price of BTC is moving above the $19,000 support. Sellers will push Bitcoin to the previous low at $18,200 if the current support is broken.

Nevertheless, the market will rise again if the current support holds. Meanwhile, BTC/USD is trading at $19,285 at the time of writing.
Bitcoin Price Indicator Reading
BTC price is in a downward movement at the 45 level of the Relative Strength Index for the 14th period. The largest cryptocurrency is capable of further decline. Bitcoin has reached the oversold zone as buyers are emerging above the 25% area of the daily stochastic.
Technical Indicator
Key resistance zones: $30,000, $35,000, $40,000
Key support zones: $25,000, $20,000, $15,000
What is the next direction for BTC/USD?
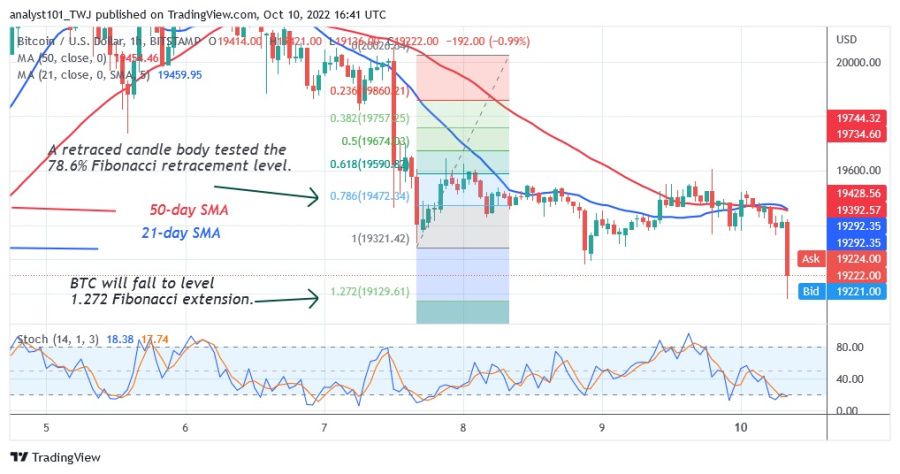
On the 1-hour chart, Bitcoin’s downtrend has reached its bearish exhaustion. On the price break down on October 7, Bitcoin corrected upwards and a candlestick tested the 78.6% Fibonacci retracement level. The correction suggests that Bitcoin will fall but reverse at the 1.272 Fibonacci extension level or $19,129.61.
Disclaimer. This analysis and forecast are the personal opinions of the author and are not a recommendation to buy or sell cryptocurrency and should not be viewed as an endorsement by CoinIdol. Readers should do their own research before investing in funds.
Source: Read Full Article
-
Sushi to test Bitcoin swaps and Opyn DeFi protocol founders cave to CFTC pressure: Finance Redefined
-
Financial surveillance, privacy and CBDCs: Why are governments going cashless?
-
51% of Ethereum blocks are now compliant with OFAC standards, raising censorship concerns
-
Crypto builders should 'give up' serving US customers for 5 to 10 years — dYdX founder
-
Swiss National Bank says it would support credit Suisse if necessary