
Bitcoin price extended its decline and spiked below $30,000. BTC is showing a few bearish signs and might extend its decline toward the $28,400 support zone.
- Bitcoin is moving lower below the $30,500 support zone.
- The price is trading below $30,300 and the 100 hourly Simple moving average.
- There was a break below a key bullish trend line with support near $30,500 on the hourly chart of the BTC/USD pair (data feed from Kraken).
- The pair could extend its decline and test the $28,400 support zone.
Bitcoin Price Extends Decline
Bitcoin price remained well below the $31,000 resistance zone. BTC spiked higher but upsides were limited above the $31,400 resistance. As a result, the price reacted to the downside below the $31,000 level.
The price declined below the $30,650 and $30,500 levels. Besides, there was a break below a key bullish trend line with support near $30,500 on the hourly chart of the BTC/USD pair. It even spiked below the $30,000 support zone.
A low is formed near $29,868 and the price is now consolidating losses. Bitcoin is now trading below $30,300 and the 100 hourly Simple moving average.
Immediate resistance is near the $30,280 level. It is close to the 23.6% Fib retracement level of the recent decline from the $31,631 swing high to the $29,868 low. The first major resistance is near the $30,500 level, above which the price could start a decent recovery wave.
The next resistance is near $30,750 and the 100 hourly Simple moving average. It is close to the 50% Fib retracement level of the recent decline from the $31,631 swing high to the $29,868 low, above which the price might retest $31,000.
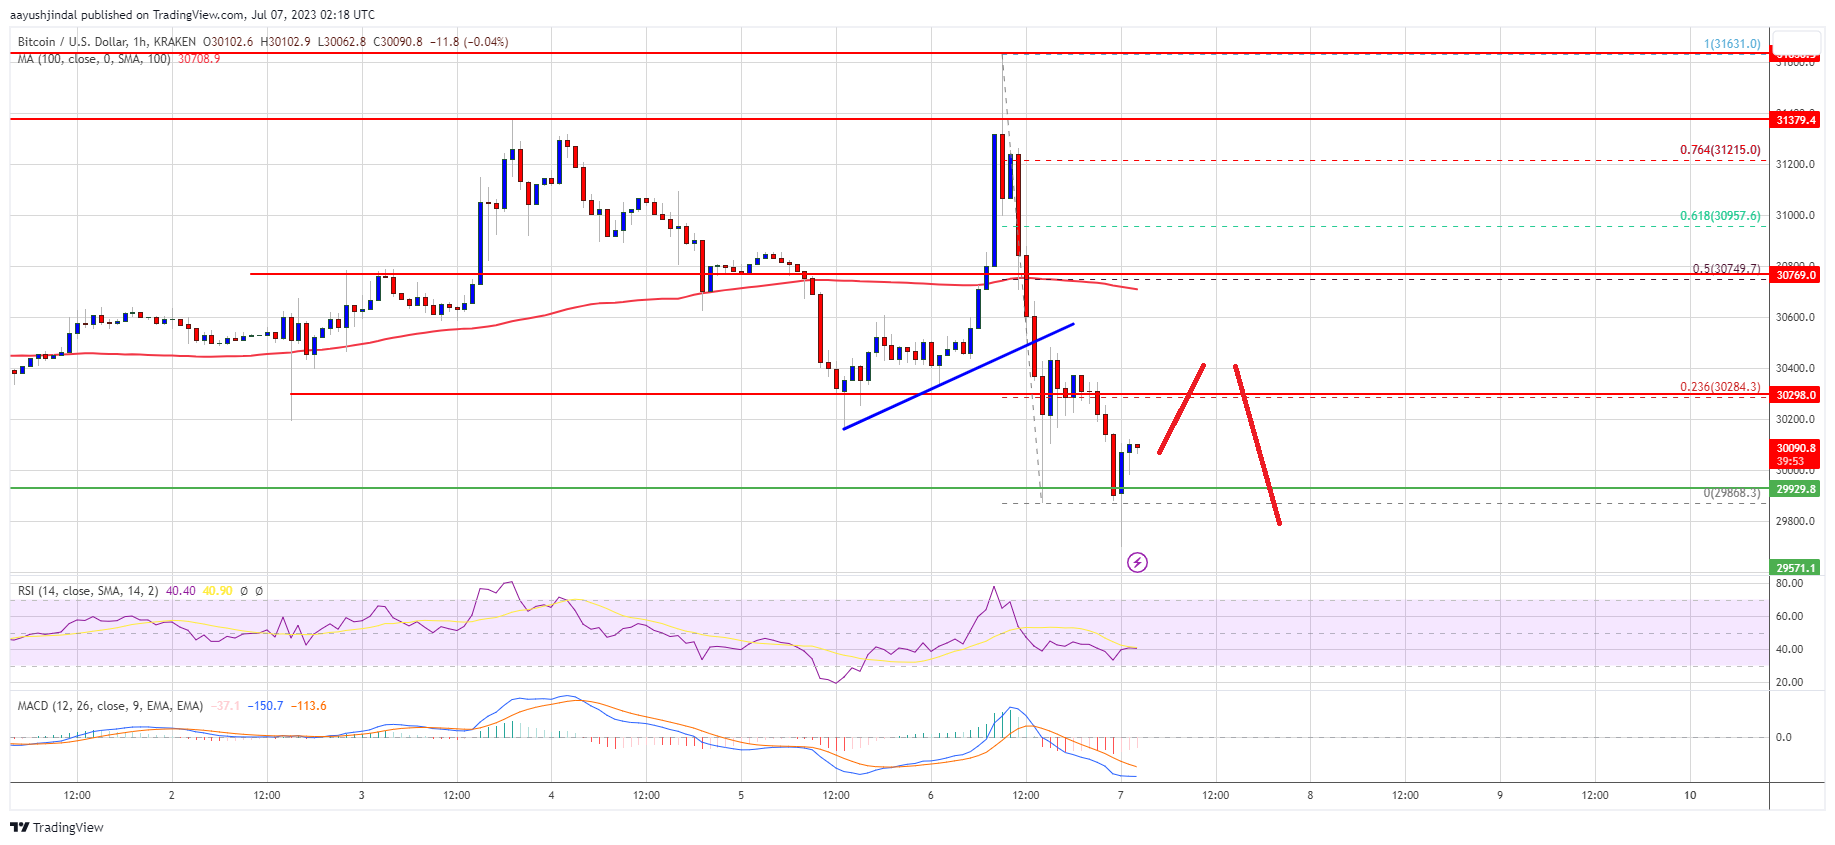
Source: BTCUSD on TradingView.com
A clear move above the $31,000 resistance could send the price further higher. The next major resistance is near the $31,400 level. Any more gains could open the doors for a move toward the $32,000 resistance zone.
More Losses in BTC?
If Bitcoin’s price fails to clear the $30,500 resistance, it could continue to move down. Immediate support on the downside is near the $29,850 level and the recent low.
The next major support is near the $29,000 level, below which there could be a drop toward $28,400. Any more losses might send the price toward the $28,000 level.
Technical indicators:
Hourly MACD – The MACD is now gaining pace in the bearish zone.
Hourly RSI (Relative Strength Index) – The RSI for BTC/USD is now below the 50 level.
Major Support Levels – $29,850, followed by $29,000.
Major Resistance Levels – $30,280, $30,500, and $30,750.
Source: Read Full Article
-
Worldoin's WLD Holds Steady as Microsoft Welcomes Sam Altman to AI Team
-
Shytoshi Kusama's 'ShibPaper': The Vision for Shiba Inu's Digital Nation
-
Fed inspector blames crypto focus, nepotism for Silvergate Bank collapse
-
Bitcoin Bulls, Rejoice! Price Nears $30k as SEC Spot ETF Approval Inches Closer – Coinpedia Fintech News
-
Crypto is in ‘arms race’ against AI-powered scams: Quantstamp co-founder