
Cryptocurrency analysts of Coinidol.com report, Litecoin (LTC) price is falling below the moving average lines.
Long-term forecast of Litecoin price: bearish
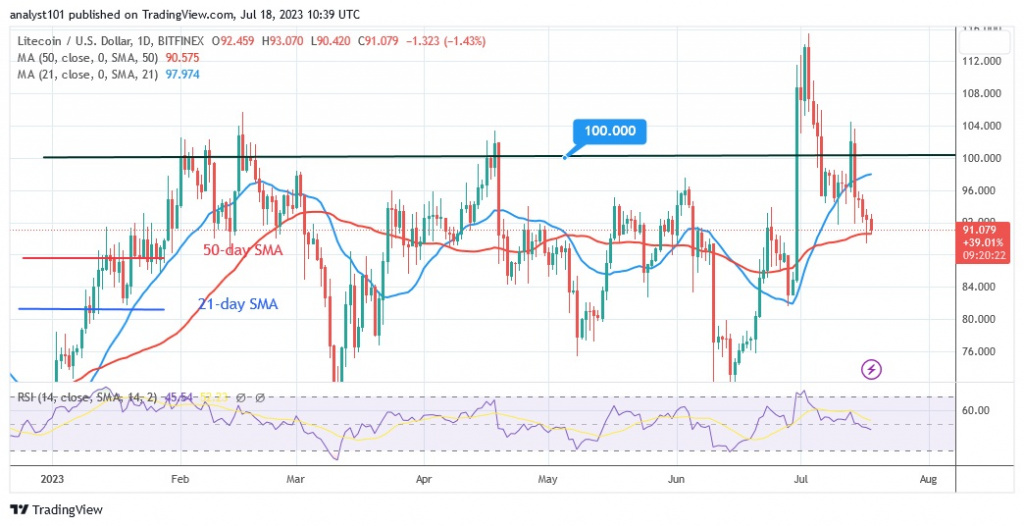
After rejecting the high of $115, the cryptocurrency value slips. Today, the LTC price has fallen to a low of $91, and the bearish momentum is expected to extend to a low of $77. The cryptocurrency price has fallen below the 21-day line SMA, but is still above the 50-day line SMA. If the bears fall below the 50-day line SMA, the selling pressure will increase again. The cryptocurrency is currently trapped between the moving average lines. As long as it is trapped between the moving average lines, Litecoin will be forced to move within a trading range.
Litecoin indicator analysis
Litecoin is now at a Relative Strength Index of 14 level 45. It is in a negative trend zone and could fall further. The downtrend is currently above the 50-day line SMA, which could lead to a continuation of the sideways trend. The downward momentum has stalled below the Stochastic daily level of 30.
Technical Indicators
Resistance levels: $100, $120, $140
Support levels: $60, $40, $20
What is the next move for Litecoin?
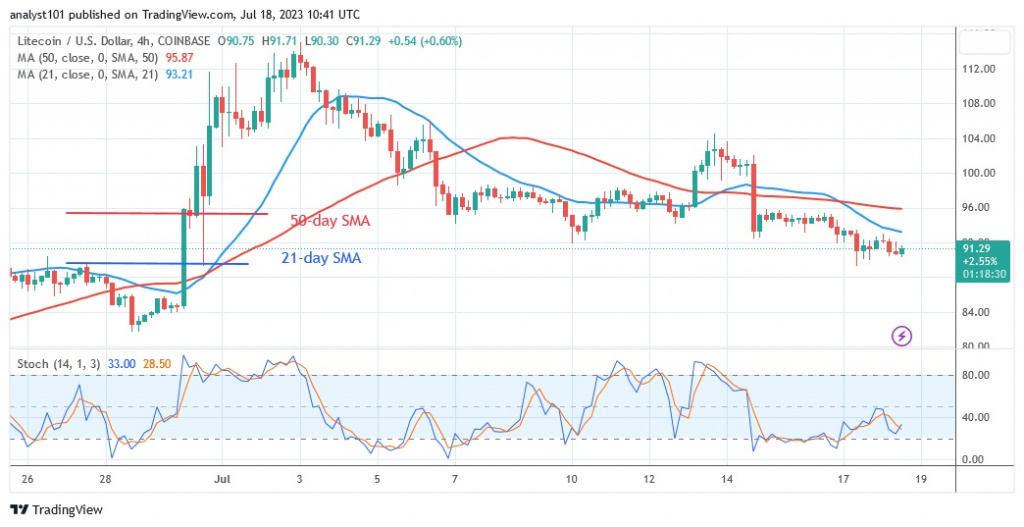
Litecoin has fallen above the support level of $90. The price of the cryptocurrency is consolidating above the current support on the 4-hour chart. Doji, or small uncertain candlesticks, dominate the price activity. These candlesticks indicate that buyers and sellers are unconcerned about the direction of the market.
Disclaimer. This analysis and forecast are the personal opinions of the author and are not a recommendation to buy or sell cryptocurrency and should not be viewed as an endorsement by CoinIdol.com. Readers should do their own research before investing in funds.
Source: Read Full Article
-
US lawmakers advance legislation blocking the digital dollar
-
Korean Giant Links Up With Polygon, Can It Push MATIC Above $1?
-
Why Chainlink Could Be The Altcoin To Watch, Top Trader Says
-
Binance says it ‘continues to serve’ Belgian users via Poland entity
-
Chainlink (LINK) Bulls Reclaim Dominance With 16% Rally, Here's Why