
After a period of correction, the Ethereum price has started to show signs of appreciation on its chart. The altcoin has managed to break past a crucial recovery region, indicating that the bulls are making an attempt to regain control.
Over the last 24 hours, Ethereum has experienced a modest 0.2% increase in price. But on the weekly chart, it has successfully reversed most of its previous losses.

However, it is important to note that Ethereum is still trading near a vital support line, and another push from the bears can make the altcoin potentially drop below its immediate support level.
The volatility of Bitcoin has had a similar impact on most altcoins, causing them to exhibit comparable price movements on their respective charts.
Related Reading: Bullish Signal: Bitcoin Realized Profit And Loss Fall To October 2020 Levels
While Ethereum is currently showing positive momentum, it is crucial for buying strength to increase in order to sustain the upward trend over the next trading sessions. From a technical perspective, the bears still maintain some control, while the bulls continue to face challenges.
Demand and accumulation levels have remained relatively low on the chart. Furthermore, the market capitalization of Ethereum has declined, indicating a decrease in buying strength based on the one-day chart.
Ethereum Price Analysis: One-Day Chart
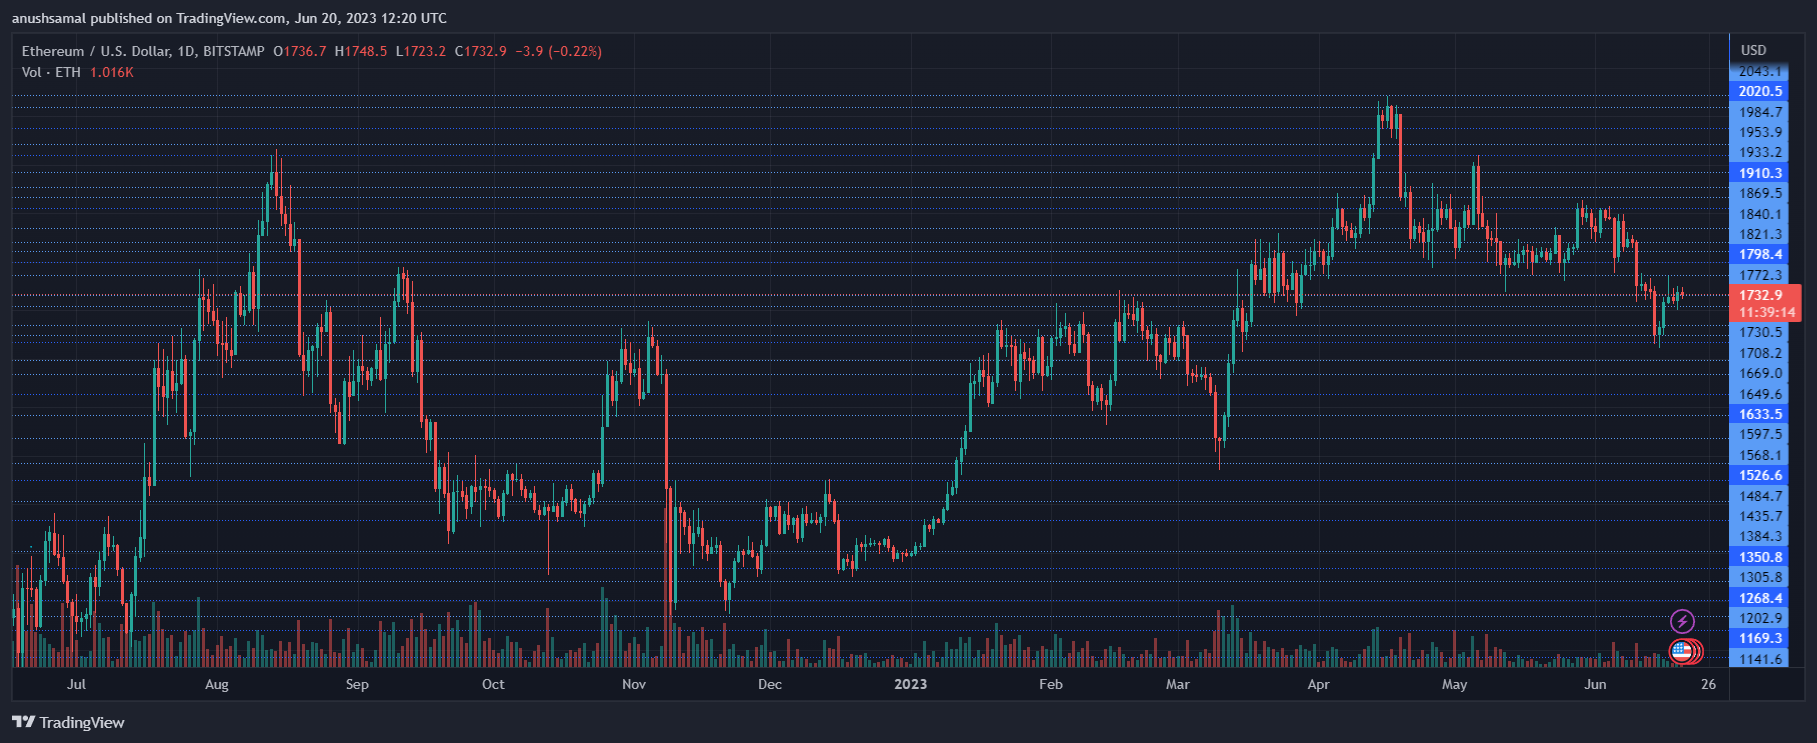
At the time of writing, Ethereum (ETH) was trading at $1,730, showing signs of recovery over the past few days. The altcoin remained in proximity to a significant support line at $1,717. On the upside, there was an overhead resistance at $1,770. If buying strength strengthens, Ethereum may aim for the $1,740 level.
However, for the bulls to regain control, a move above $1,770 would be beneficial. Conversely, if the current price level experiences a decline, ETH could drop below the $1,717 support and potentially trade around $1,710.
Unfortunately, the trading volume of ETH in the last session was in the red, indicating more selling pressure in the market.
Technical Analysis
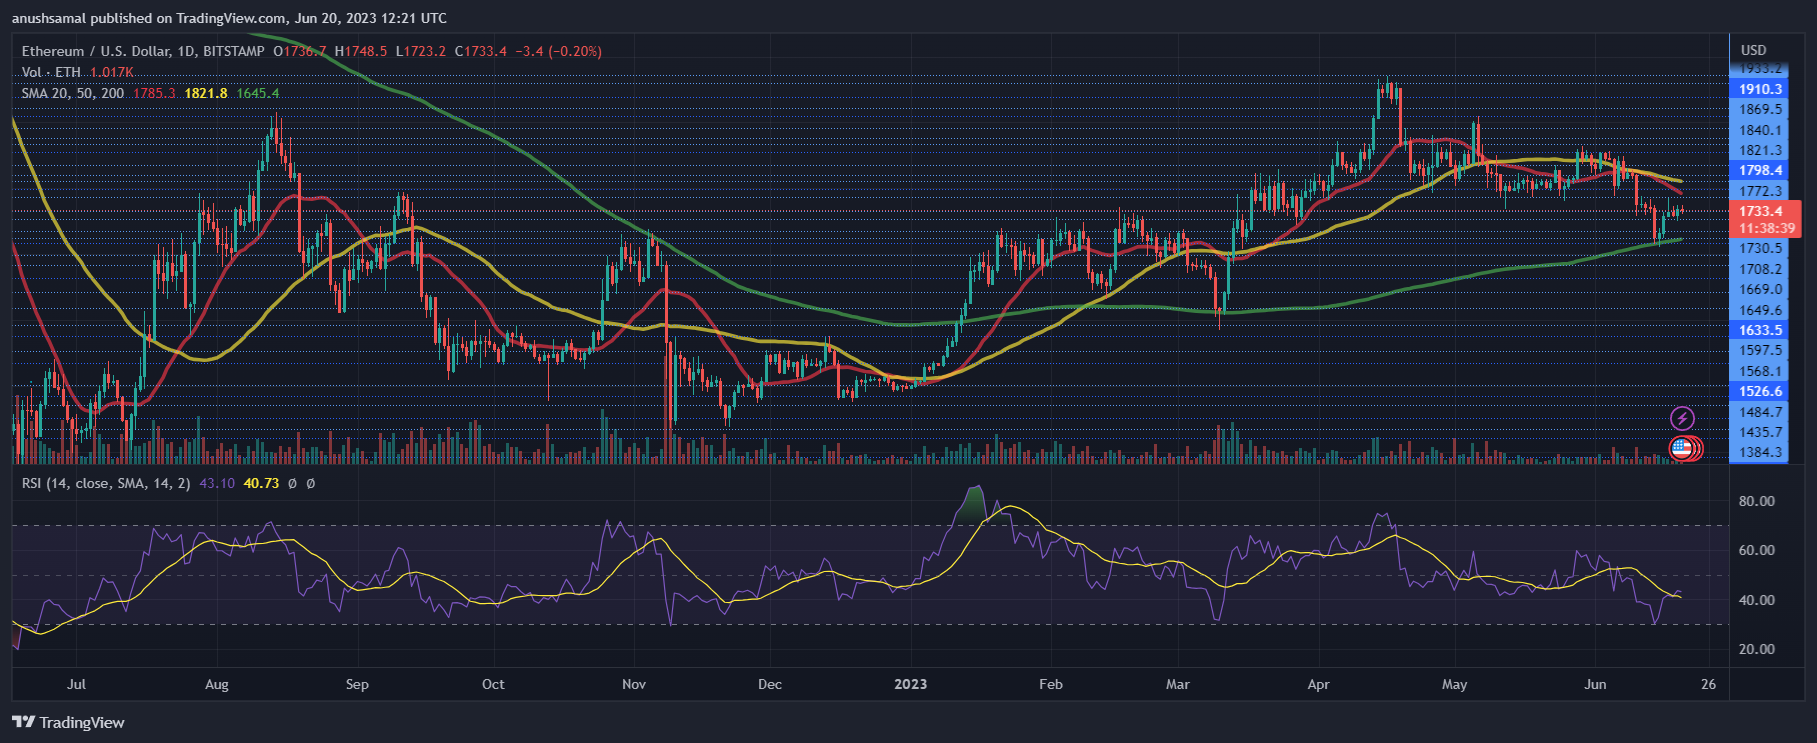
Following a visit to the oversold zone, Ethereum has made attempts to reverse the situation. However, the demand for ETH has remained low. The Relative Strength Index (RSI) indicates increased selling strength as it remains below the half-line.
Furthermore, the price of ETH has moved below the 20-Simple Moving Average (SMA) line, suggesting that sellers have been driving the price momentum in the market.
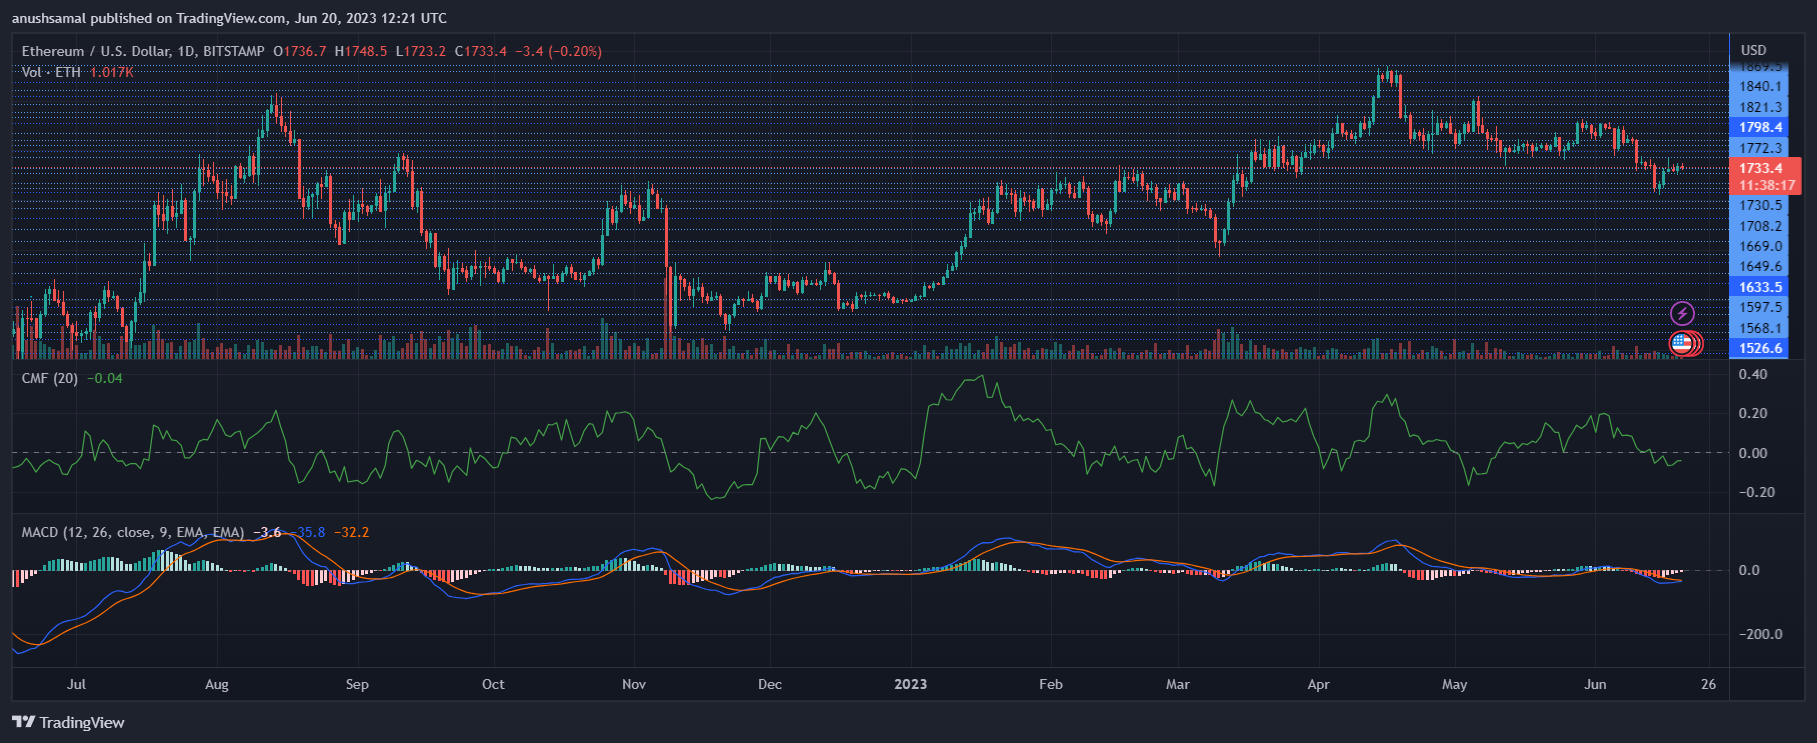
In line with other technical indicators, Ethereum showed sell signals on the chart. The Moving Average Convergence Divergence (MACD) displayed a red signal, indicating a bearish price momentum.
Although, it’s worth noting that the signals were declining, suggesting a potential turnaround in the price in the upcoming trading sessions.
On the other hand, the Chaikin Money Flow (CMF) indicated a decrease in capital inflows as it remained below the half-line. This decrease in buying interest for ETH may further contribute to the bearish sentiment.
Source: Read Full Article
-
Terra co-founder Do Kwon says he’s not ‘on the run’
-
Will Genesis Bankruptcy Spell Disaster for Grayscale's GBTC and DCG? – Coinpedia Fintech News
-
US election agency approves use of NFTs as campaign fundraising incentive
-
L2 is crucial to Ethereum decentralization, censorship resistance, says researcher
-
CTFC cracks down on DeFi protocols Opyn, ZeroEx and Deridex