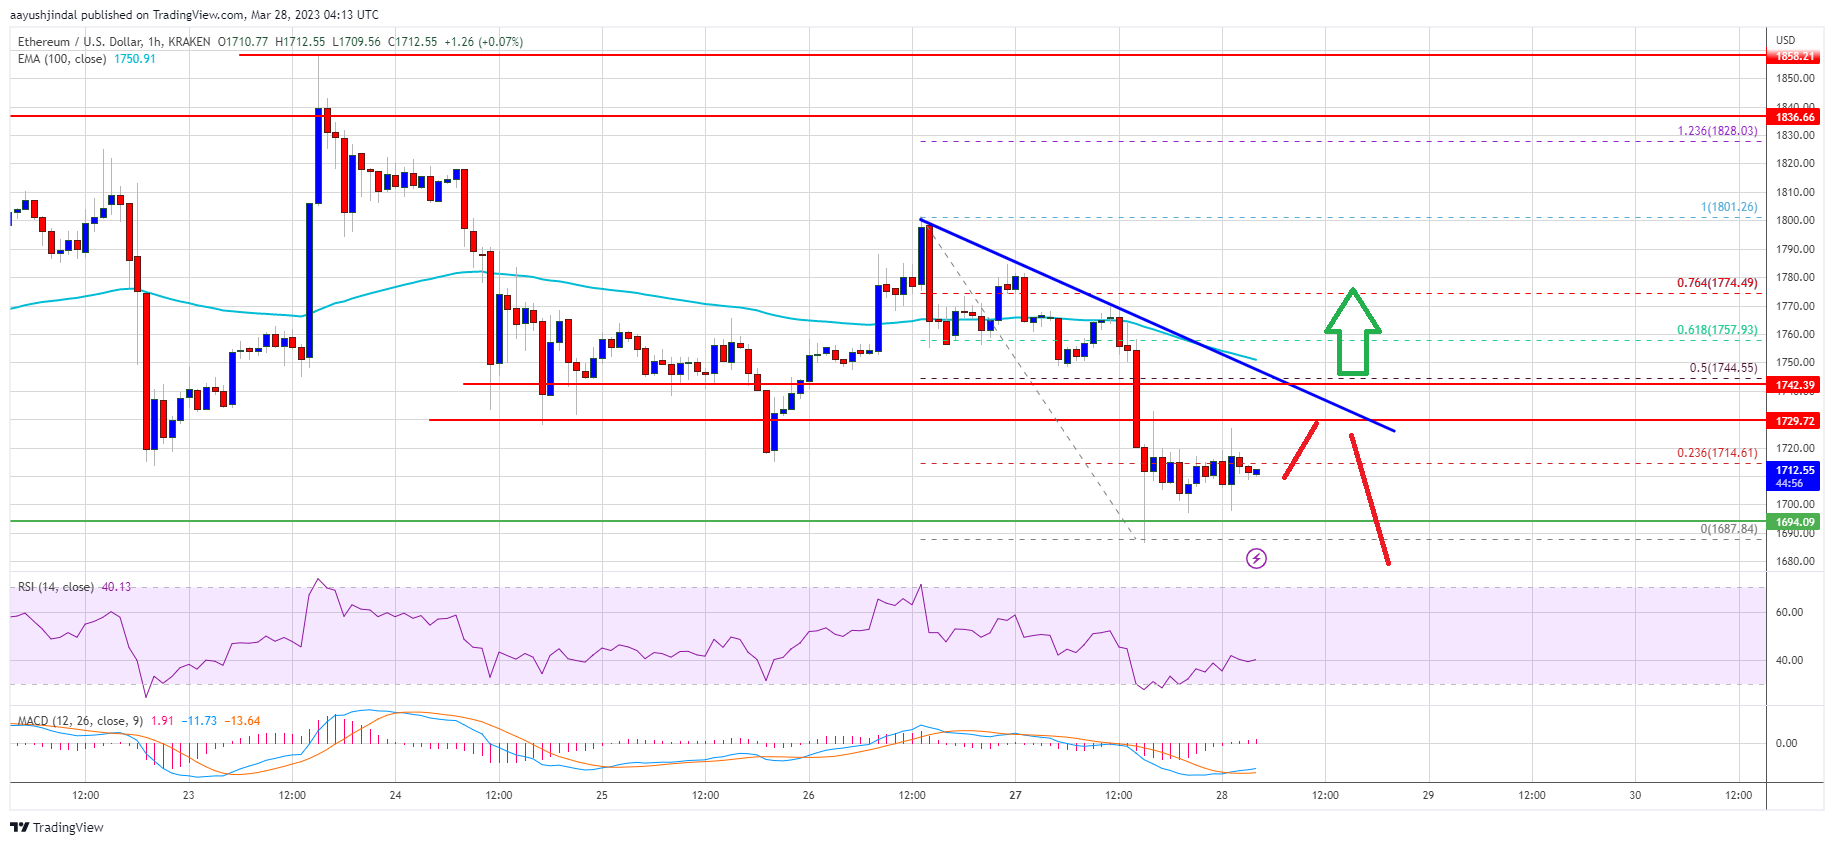
Ethereum price started a fresh decline from the $1,800 resistance against the US Dollar. ETH could decline further if the bulls fail to protect the $1,680 support.
- Ethereum started a downside correction below $1,780 and $1,750.
- The price is trading below $1,750 and the 100 hourly simple moving average.
- There is a key bearish trend line forming with resistance near $1,740 on the hourly chart of ETH/USD (data feed via Kraken).
- The pair could extend its decline if it stays below $1,740 and $1,750.
Ethereum Price Extends Decline
Ethereum price struggled to gain pace above the $1,800 resistance zone. ETH traded as high as $1,801 and recently started a fresh decline. There was a clear move below the $1,750 support zone.
The price declined over 3% and traded below $1,720, similar to bitcoin. A low is formed near $1,687 and the price is now consolidating losses. It is now consolidating near the 23.6% Fib retracement level of the recent decline from the $1,801 swing high to $1,687 low.
Ether price is also trading below $1,750 and the 100 hourly simple moving average. Besides, there is a key bearish trend line forming with resistance near $1,740 on the hourly chart of ETH/USD.
On the upside, the price is facing resistance near the $1,745 zone and the trend line. It is close to the 50% Fib retracement level of the recent decline from the $1,801 swing high to $1,687 low. The next major resistance is near the $1,760 zone. A clear move above the $1,760 resistance zone might start a steady increase.
Source: ETHUSD on TradingView.com
The next major resistance might be $1,800. Any more gains could set the pace for a test of the $1,860 resistance zone in the near term.
Downside Break in ETH?
If ethereum fails to clear the $1,745 resistance, it could start another decline. An initial support on the downside is near the $1,700 level.
The next major support is near the $1,685 zone. If there is a break below $1,685, the price might gain bearish momentum and drop towards $1,600. Any more losses might call for a test of the $1,550 level.
Technical Indicators
Hourly MACD – The MACD for ETH/USD is now gaining momentum in the bearish zone.
Hourly RSI – The RSI for ETH/USD is now below the 50 level.
Major Support Level – $1,685
Major Resistance Level – $1,745
Source: Read Full Article
-
Coinbase calls Pepe a ‘hate symbol,’ prompting calls to boycott the exchange
-
Marathon Digital Selects Abu Dhabi For Immersion Crypto Mining Expansion
-
Ripple (XRP) Legal Defender Lauds Judge Torres' Ruling As A Victory For The People
-
Blast network hits $400M TVL, rebuts claim that it’s too centralized
-
UK pushes crypto efforts forward through financial services reforms


