
Cardano’s native token, ADA, has been significantly affected by the recent downturn in the cryptocurrency market, experiencing a notable decline in price. Despite a recent surge of over 6% in the last 24 hours, the bearish sentiment continues to exert its influence.
Over the past week, Cardano has encountered a loss of approximately 26% in value, resulting in the breaking of crucial support levels that have now transformed into resistance levels.

From a technical outlook, Cardano indicates a prevailing bearish trend, with both demand and accumulation levels remaining relatively low. It becomes crucial for the coin to overcome the overhead resistance in order to mitigate the growing strength of bearish forces and facilitate a potential recovery.
Presently, the coin is oversold, prompting the emergence of buyers aiming to surpass the resistance barriers. Furthermore, the decline in Bitcoin’s value in recent days, as it revisited the $26,000 level, has had a negative impact on various altcoins, including Cardano. Consequently, the market capitalization of Cardano has declined, indicating diminished buying strength in the market.
Cardano Price Analysis: One-Day Chart
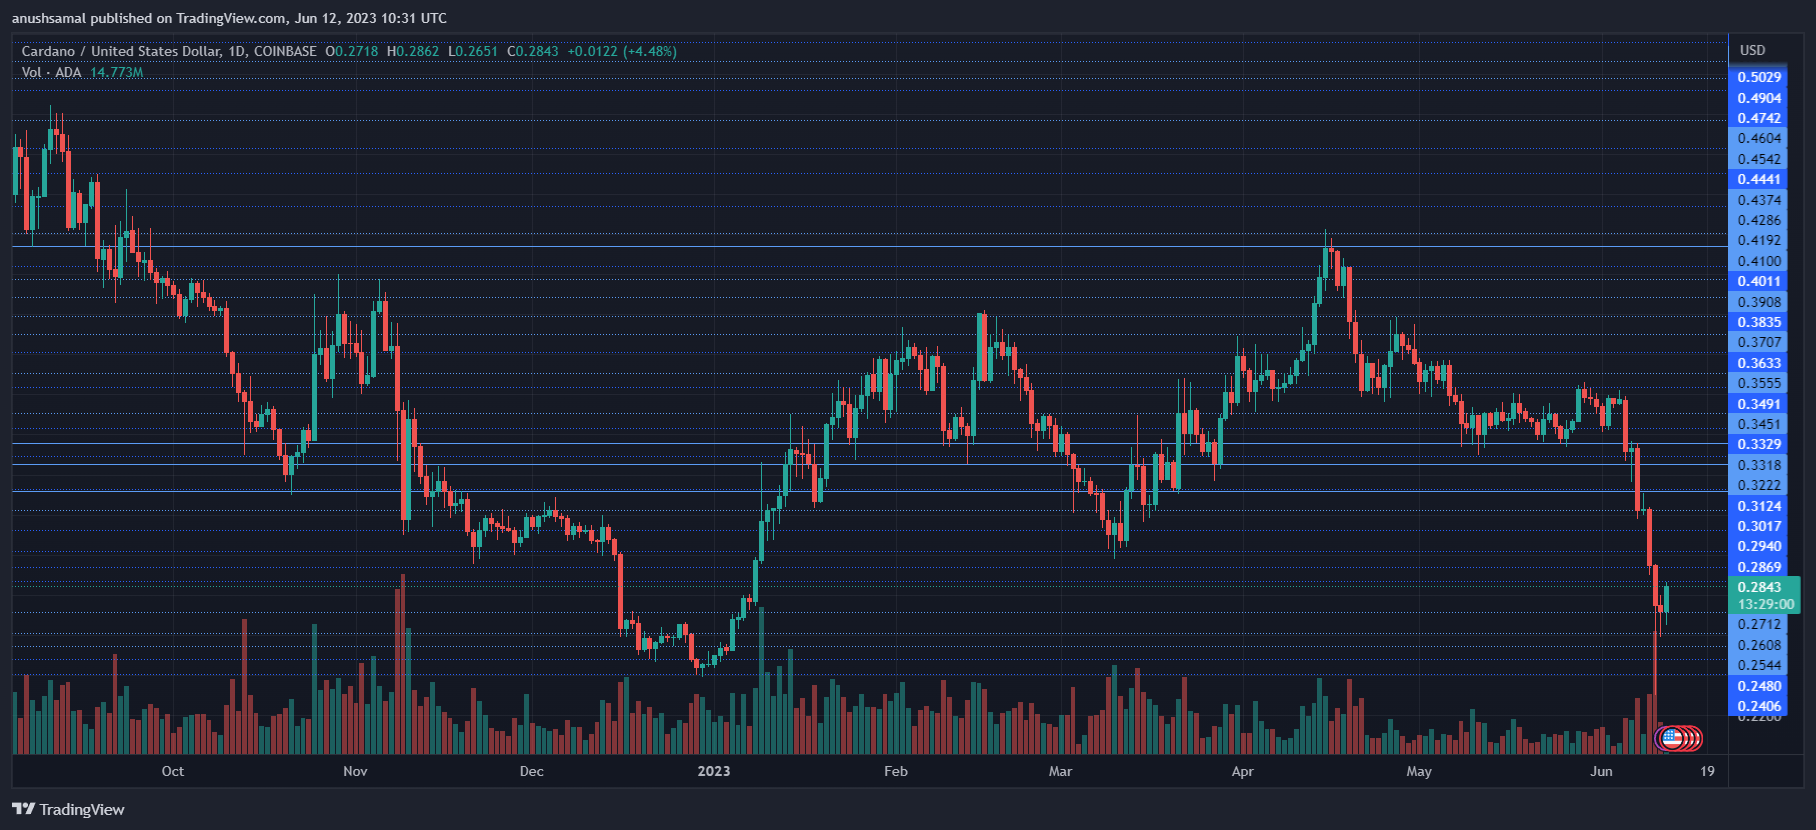
ADA was trading at $0.28, at the time of writing. Following its rejection at the $0.34 level, the bears have taken control of the price trajectory. Presently, ADA has revisited a multi-month low price level. This signified a bearish trend and the crucial resistance level for the altcoin is observed at $0.30.
Should ADA face rejection at this level, there is a possibility of the price descending further below its current level. In the event of further depreciation, the coin may find support initially at $0.25 and potentially even lower.
The trading volume for Cardano in the last session was relatively low, suggesting that sellers currently hold an advantage in the market.
Technical Analysis
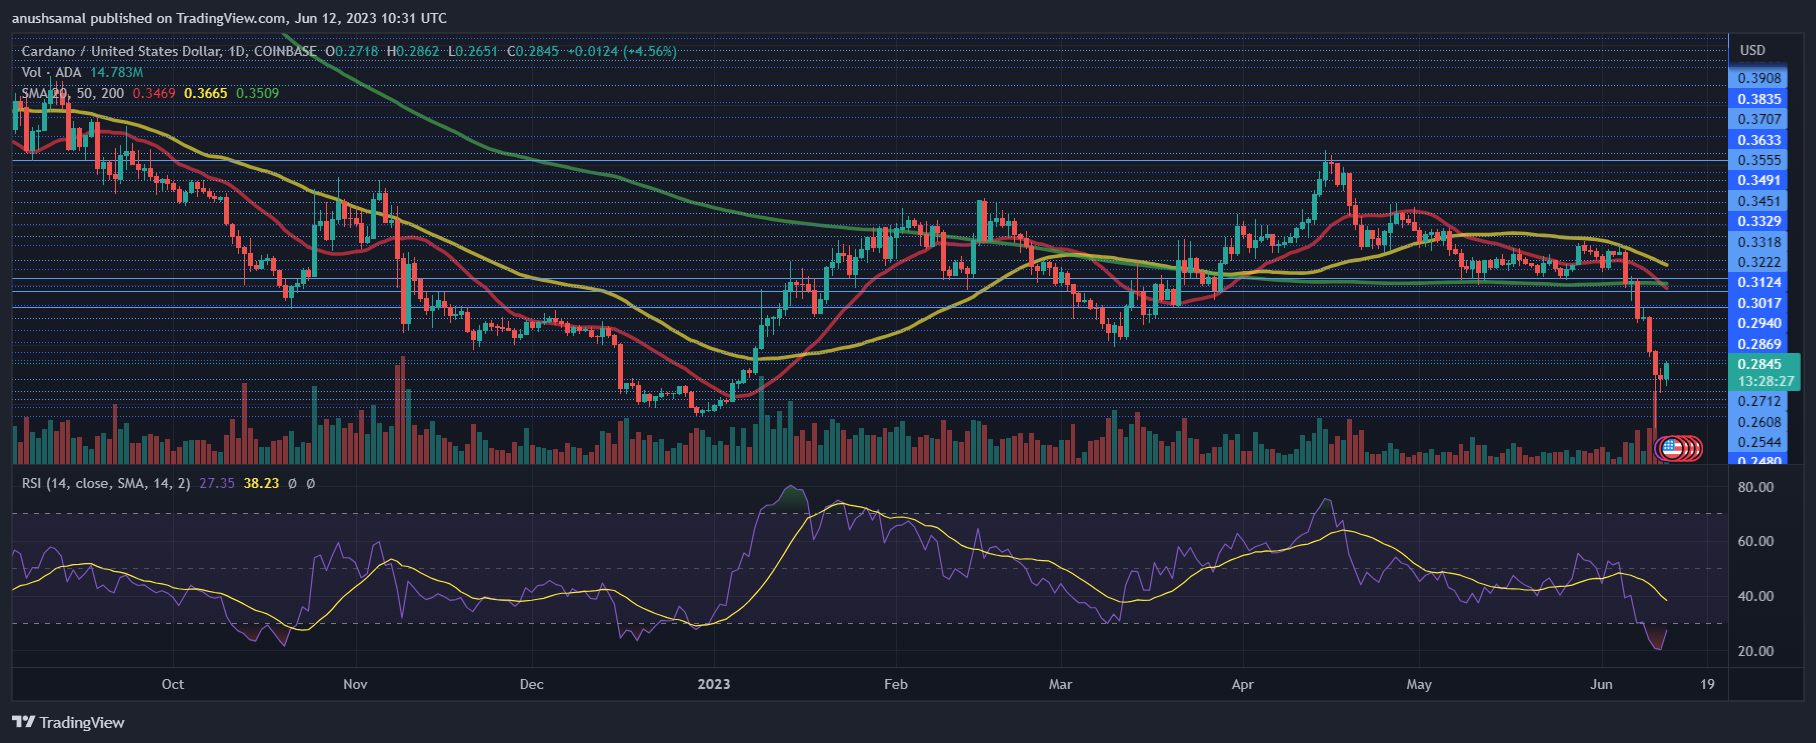
Following the rejection at $0.34, Cardano (ADA) has struggled to regain positive momentum and attract demand. The Relative Strength Index (RSI) has dipped below the half-line and even further below the 30-mark, indicating that the coin is significantly undervalued and oversold.
Furthermore, the price of ADA has dropped below the 20-Simple Moving Average (SMA) line, suggesting that selling pressure is currently driving the price momentum.
In order to revive demand in the market, ADA needs to overcome the resistance level of $0.30. Breaching this crucial barrier could potentially ignite a recovery and attract buyers back into the market.
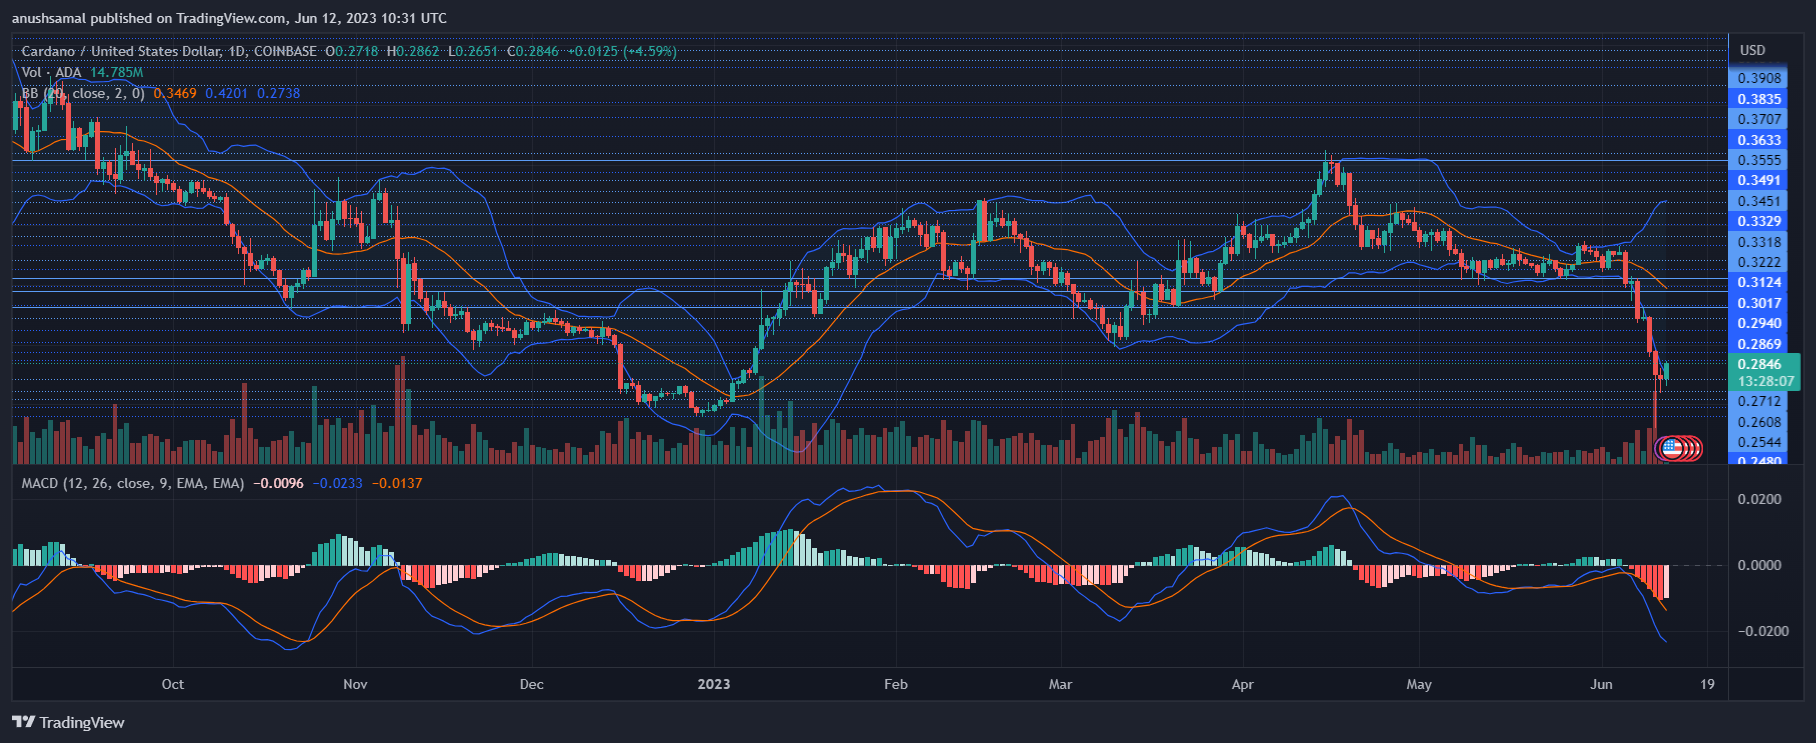
Due to the low demand for ADA, sell signals have emerged, suggesting a potential continuation of the downtrend. The Moving Average Convergence Divergence (MACD), which indicates price momentum and potential reversals, has formed red signal bars, aligning with sell signals for ADA.
Additionally, the Bollinger Bands, which reflect price volatility and fluctuations, have significantly diverged. This indicates that there may be increased price volatility and fluctuation in the upcoming trading sessions.
Source: Read Full Article
-
Why is Bitcoin Pumping? Is Crypto Being Regulated? Here's What Kevin O'Leary Has To Say – Coinpedia Fintech News
-
Matter Labs steps back as zkSync launches ecosystem portal managed by DappRadar
-
Pro-crypto lawmaker Tom Emmer ends hours-long speaker campaign: Report
-
Sequoia Capital marks down entire $214M FTX stake to zero
-
Litecoin (LTC) Price Analysis: Bulls Aim Key Upside Break