
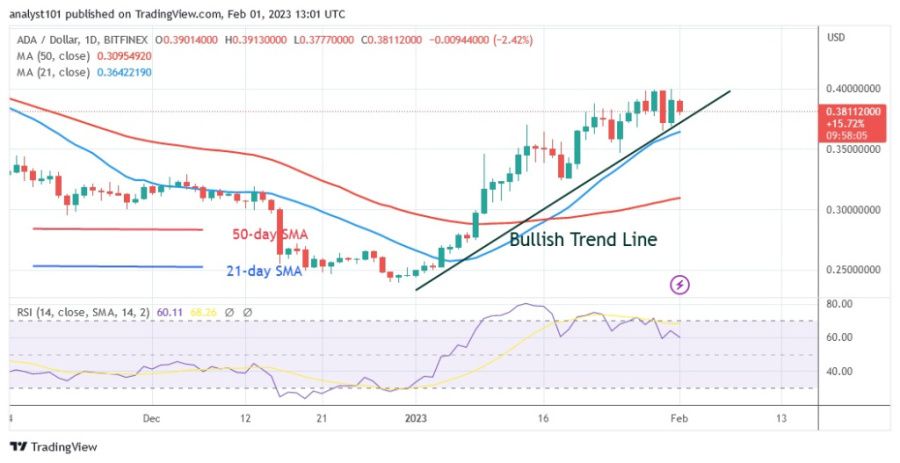
The price of Cardano (ADA) has remained within the bullish trend zone. The uptrend has reached a high of $0.40.
Cardano price long-term forecasts: bullish
Buyers have worked tirelessly over the past three days to keep the price above the recent high. If the current barrier is broken, Cardano will rise to a high of $0.45. Meanwhile, the $0.40 barrier has put the brakes on the upward movement. If the price falls below the moving average lines, the uptrend could expire to the downside. The market has entered an overbought area at $0.40, so the current upward momentum is hampered.
Cardano indicator analysis

On the Relative Strength Index for the 14 period, Cardano is at the 57 level. Despite the decline, Cardano is still in the up zone. The moving average lines are close to each other and the price bars are above them. If the price falls below the moving average lines, selling pressure may return. Cardano is losing ground as it falls below the 80 level of the daily stochastic.
Technical indicators
Key resistance zones: $1.00, $1.20, $1.40
Key support zones: $0.60, $0.40, $0.20
What is the next move for Cardano?
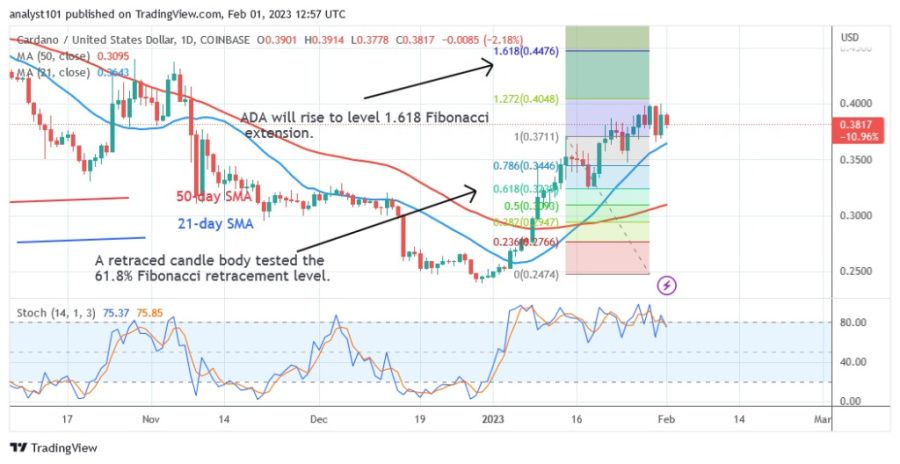
Cardano’s uptrend could continue despite resistance at $0.40. A retraced candlestick tested the 61.8% Fibonacci retracement line on the January 14 rise. According to the retracement, Cardano will rise to the 1.618 level of the Fibonacci extension or $0.4476. The altcoin is currently trading at $0.37.
Disclaimer. This analysis and forecast are the personal opinions of the author and are not a recommendation to buy or sell cryptocurrency and should not be viewed as an endorsement by CoinIdol. Readers should do their own research before investing in funds.
Source: Read Full Article
-
Thai political party looking at PM race promises $300 in crypto upon victory: Report
-
IMF sees climate change, DAOs, CBDC as threats to Marshall Islands, urges reforms
-
Issuing digital euro, or ‘Cash+,’ is probably a duty, French central banker says
-
Crypto Market Crash, Binance (BNB) Price Drops Heavily Following Resignation of CEO Changpeng Zhao – Coinpedia Fintech News
-
Reddit Deprecates The MOON Bridge To Arbitrum Nova, Users To Lose 4.77 Million Tokens