
Volatility is back for the Bitcoin price and the crypto market, but it currently favors the bears as value tumbles in the past few days. The nascent sector was moving sideways, but a liquidation cascade forced prices into critical support levels, but the worse might yet come if BTC fulfills a prophecy.
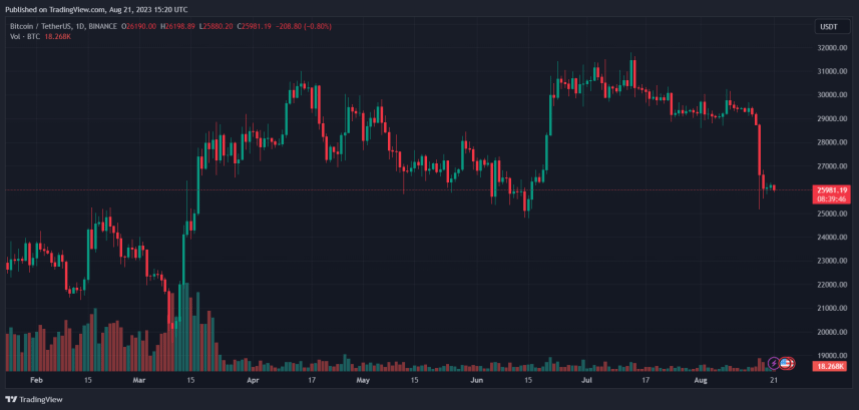
As of this writing, the Bitcoin price trades at $26,100 with sideways movement in the last 24 hours. Over the past week, the price of BTC corrected back to $26,000 after its lost support at the high of its current levels.
Is The Worst Yet To Come For The Bitcoin Price?
Bloomberg Intelligence’s Senior Commodity Analyst Mike McGlone shared an analysis on social media platform X. Therein, the analyst classified Bitcoin as one of the “best-performing assets in history,” the cryptocurrency rose from $100 to around $70,000 in less than ten years.
At the same time, McGlone pointed out the similarities between the Bitcoin price chart and the 1930s stock market chart. During this period, the US economy went through one of its worse history leading to a series of economic reforms.
Comparing both sectors, McGlone forecasted a potential drop in the Bitcoin price once the US Federal Reserve (Fed) turns its monetary policy around. As seen in the chart below, the financial institution has raised interest rates to slow down inflation.
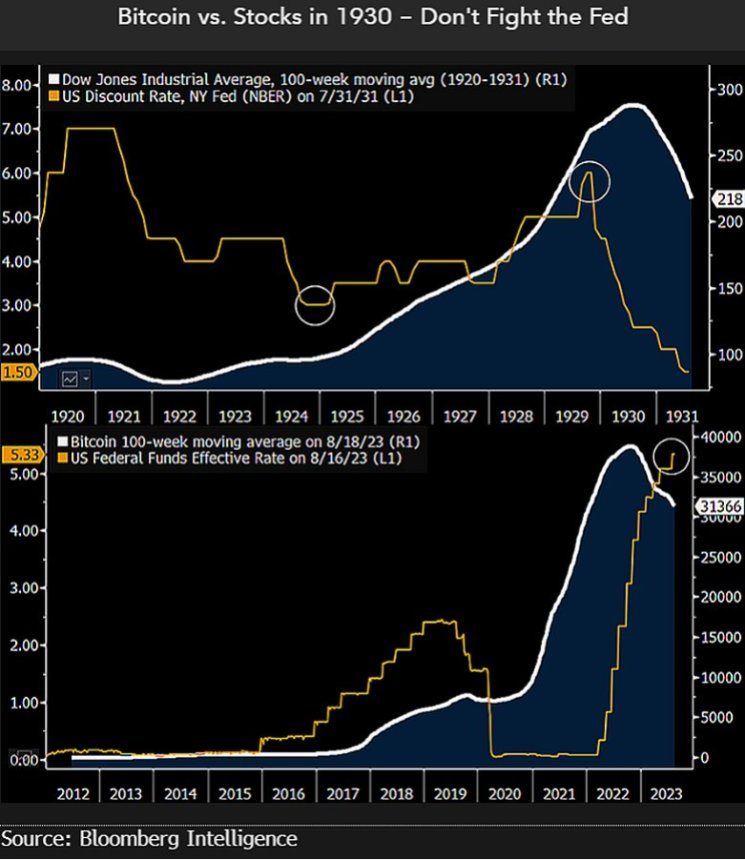
As a result, BTC’s price has declined as liquidity leaves financial markets and uncertainty increases. Unlike popular belief, the Bloomberg Intelligence analyst expects the cryptocurrency to dip further if the Fed loses its monetary policy. McGlone explained:
One of the best-performing assets in history and a leading indicator — Bitcoin — appears similar to the stock market in 1930. Statistician and entrepreneur Roger Babson began warning about elevated equity prices well before economist Irving Fisher proclaimed a “permanently high plateau” in 1929. The Fed tilts our bias toward a stance similar to Babson’s.
The analyst above focuses on the increasing potential benefits for investors getting out of BTC and into government-based financial instruments, such as US Treasury notes which are currently yielding 5%. As long as this environment continues, BTC shows “mostly downward biases,” as the analyst concluded.
On short timeframes, the price of BTC continues to trade sideways, licking its wounds from last week’s liquidation cascades. The last time the cryptocurrency experienced a similar price action was in late 2022, and it took several weeks of sideways price action before a recovery was possible.
Cover image from Unsplash, chart from Tradingview
Source: Read Full Article
-
Justin Sun’s Crypto Exchange Poloniex Exploited For $126 Million, Offers Hacker 5% Bounty
-
Ripple News : XRP Price Remarkable Surge Amidst Cryptocurrency Rally – Coinpedia Fintech News
-
BitExchange enables XRP options trading, no need for ownership
-
Crypto Market Crash, Binance (BNB) Price Drops Heavily Following Resignation of CEO Changpeng Zhao – Coinpedia Fintech News
-
Binance exit aftershock: Can one resignation tip the crypto trust scales?