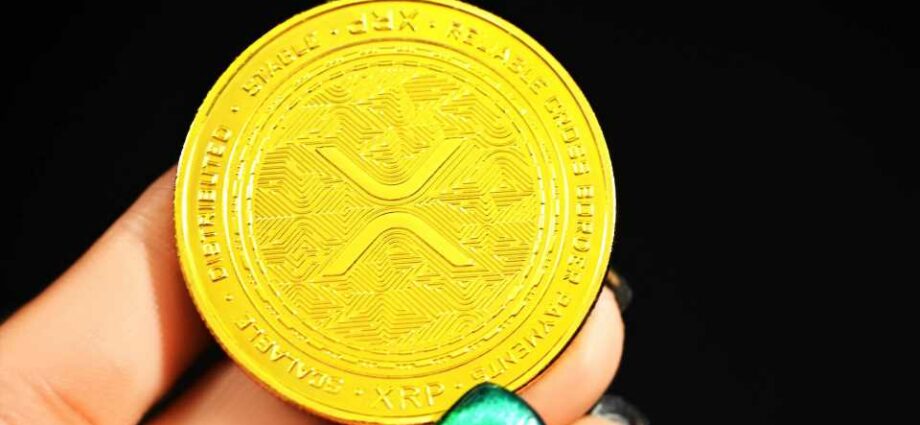
Since 2020, XRP has struggled to remain relevant and valuable to its investors. The US Securities and Exchange Commission’s attack on the project brought a drastic decline that no one expected. However, amid the ongoing case, XRP showed resilience, leading supporters to commend it as an asset to watch.
Even though the price has seen some pullbacks and rallies, the trend aligns with the fluctuations in the overall crypto market due to environmental factors. But today, the global market cap is up by 0.06%. XRP surpassed the first five assets with a 2.33% price gain in 24 hours.
XRP Price Gains Even With Declining Network Activities
The current price outlook for XRP is positive. The controversial asset trades above its 50-day and 200-day simple moving averages.
XRP price is $0.4814, with a 2.33% increase in 24 hours. Its seven-day price gains also show an addition of 5.89% in the same time frame. The hourly price change is also green, and CoinMarketCap data indicates the asset recorded a price change of 2.87% since yesterday’s closing price of $0.4803.
The difference between XRP’s opening and closing price indicates an uptrend since April 28, and continuing today. There’s hope for more gains as it remains above its SMAs.
However, the trading volume is declining by 48.86% in 24 hours. This indicates the traders’ uncertainty, given the upcoming summary judgment by Judge Torres.
XRP Technical Outlook
The Simple Moving Average (SMA) indicator computes the closing price of XRP in the nearest days. Since XRP is trading above its 50-Day and 200-Day Simple Moving Average (SMA), there are strong bullish signals in the market in the coming days to weeks.
For the past 39 days, March 21, 2023, there have been persistent Buy signals from the 200-Day SMA, while the 50-Day Buy Signal occurred in the last two days, April 27. As such, the XRP price may experience more rallies, resulting in price volatility for the asset.
On the other hand, the Relative Strength Index (RSI) value of XRP is 49.02 at the time of writing. Its upward movement shows that the indicator is gradually approaching the overbought region (above 70). Thus, there would be a possible price rise for short and long-term trades.
XRP’s Moving Average Convergence/Divergence (MACD) is below the signal line, confirming the asset’s current price drop. However, the faded histogram bar represents possible price growth in the nearest days.
The asset’s support levels are $0.3074, $0.3622, and $0.4105, while its resistance levels are $0.5527. XRP is trading below its $0.5527 resistance. If the bullish pressure continues, the asset could break through this resistance level.
According to the abovementioned indicators, XRP has a promising price outlook for the coming days and could extend to weeks. Thus, expect more rallies.
Featured image/Pexels and chart/TradingView
Source: Read Full Article
-
Binance Coin Breaks Through Resistance at $300 and Targets High at $350
-
ConsenSys launches zkEVM private beta testnet
-
US authorities arrest former Coinbase manager, alleging insider crypto trading
-
Bitcoin Weekly Chart Completes Double Top: Market Shifts Ahead?
-
Crypto users renew calls for Satoshi Nakamoto to win Nobel Memorial Prize for economics


