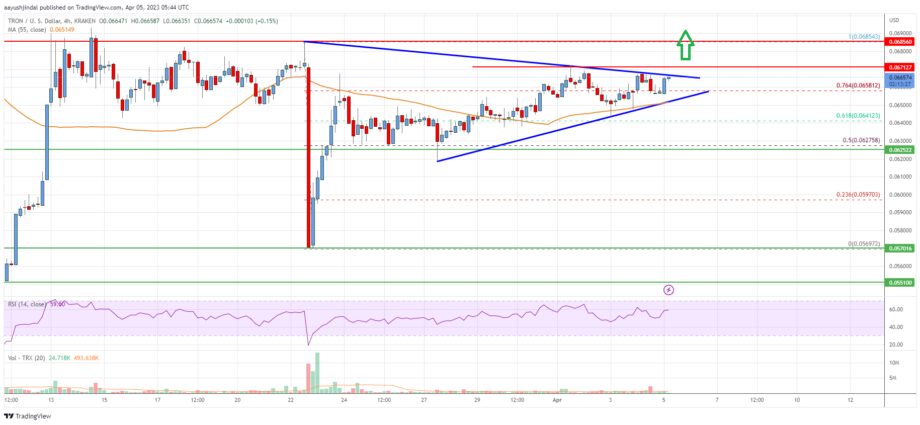
TRON price started a fresh increase above $0.0632 against the US Dollar, similar to Bitcoin. TRX’s price could rise further if it clears the $0.0665 resistance.
Tron Price Analysis
In the past few sessions, Tron price started a decent increase from the $0.060 support zone against the US Dollar. TRX’s price remained well-bid and was able to climb above the $0.062 zone.

It traded above the $0.0622 and $0.0632 resistance levels to move into a positive zone. Besides, there was a break above a key contracting triangle forming with resistance near $0.0665 on the 4-hours chart. The pair settled above the 61.8% Fib retracement level of the downward move from the $0.06855 swing high to the $0.0570 low.
The price is now trading above $0.064 and the 55 simple moving average (4 hours). On the upside, TRX is facing resistance near the $0.0665 level.
The next major resistance is near the $0.0685 level. A close above $0.0685 could send the price toward the $0.0700 resistance zone. Any more gains might send TRX price toward $0.072 or the 1.236 Fib extension level of the downward move from the $0.06855 swing high to the $0.0570 low, above which the price could even rise toward $0.075.
On the downside, initial support is near the $0.0658 level. The next major support is now forming near $0.0640. If there is a downside break below the $0.0640 support, the price might revisit the $0.062 support. Any more losses might call for a move toward the $0.060 zone in the near term.

Tron (TRX) Price
The chart indicates that TRX’s price is now trading above $0.0632 and the 55 simple moving average (4 hours). Overall, the price could continue to move up if it breaks the $0.0665 resistance zone.
Technical Indicators
4 hours MACD – The MACD for TRX/USD is now gaining momentum in the bullish zone.
4 hours RSI – The RSI for TRX/USD is above the 50 level.
Key Support Levels – $0.0658 and $0.0640.
Key Resistance Levels – $0.0665, $0.0685, and $0.072.
Source: Read Full Article
-
This Technical Signal Says Bitcoin Dominance Has Potentially Peaked
-
a16z opening London crypto office citing ‘predictable’ environment
-
Bitcoin's Upcycle Shows Small Drawdowns, Report
-
KyberSwap DEX exploited for $46 million, TVL tanks 68%
-
US Inflation Data Looms: How Will Crypto Market React To The CPI Report on 10th May – Coinpedia Fintech News