Earn Your First Bitcoin Sign up and get $12 Bonus Referral bonus up to $3,000
- Stellar lumen price is struggling below the $0.0950 resistance zone against the US Dollar.
- XLM price is now trading below $0.0920 and the 55 simple moving average (4 hours).
- There is a key bearish trend line forming with resistance near $0.0920 on the 4-hour chart (data feed via Kraken).
- The pair could start a recovery wave if it clears the $0.092 resistance.
Stellar lumen price is trading below $0.0920 against the US Dollar, similar to Bitcoin. XLM price could extend losses if it stays below $0.0920.
Stellar Lumen Price Analysis (XLM to USD)

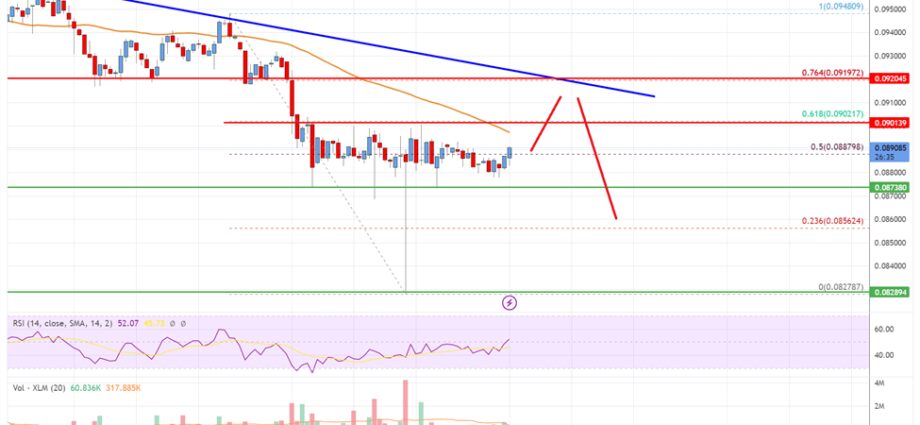
After a close below $0.0950, Stellar Lumen price moved into a bearish zone against the US Dollar. The XLM/USD pair gained bearish momentum below the $0.090 support zone.
Finally, there was a spike below the $0.085 level. A low is formed near $0.0828 and the price is now correcting losses. It is still trading below $0.0920 and the 55 simple moving average (4 hours). There is also a key bearish trend line forming with resistance near $0.0920 on the 4-hour chart.
On the upside, the price is facing resistance near the $0.090 level and the 55 simple moving average (4 hours). It is close to the 61.8% Fib retracement level of the downward move from the $0.0948 swing high to the $0.0827 low.
The next major resistance is near the $0.0920 zone and the trend line. It is close to the 76.4% Fib retracement level of the downward move from the $0.0948 swing high to the $0.0827 low. A clear upside break above the $0.092 zone might send the price toward $0.0950. Any more gains could lead the price toward the $0.1000 level or even $0.1050.
Initial support on the downside is near the $0.0875 level. The main support is near the $0.085 zone. Any more losses could lead the price toward the $0.0820 level in the near term, below which the price might even retest $0.0800.

Stellar Lumen (XLM) Price
The chart indicates that XLM price is now trading below $0.0920 and the 55 simple moving average (4 hours). Overall, the price could start a major decline if there is a clear move below the $0.0875 support.
Technical Indicators
4 hours MACD – The MACD for XLM/USD is gaining momentum in the bullish zone.
4 hours RSI – The RSI for XLM/USD is now above the 50 level.
Key Support Levels – $0.0875 and $0.082.
Key Resistance Levels – $0.090, $0.0920, and $0.0950.
Source: Read Full Article
-
Kava Launches Liquid Staking With Successful Mainnet Upgrade
-
Binance Is Ending Visa Debit Card Services in European Economic Area
-
Minerva's Circle launches at DCENTRAL Miami 2022
-
Nifty News: Top 10 CryptoPunks wallet lays dormant, house sells on OpenSea, and more
-
Litecoin Is In A Tight Trading Range And Reaching Bearish Exhaustion