
The Solana price experienced notable gains in mid-June, but a recent correction phase has pulled it down to $22, which has found strong support. The technical outlook currently leans towards the bears, suggesting a potential slight dip before a possible turnaround.
The altcoin attempted to rise from the support level in the past week, but the bullish momentum waned. Despite the chance of a rally due to a demand zone below $22, a new resistance at the $25 level may pose a challenge.
As Bitcoin slipped into the $29,000 range, other altcoins also faced downward pressure on their charts. For SOL to reverse its trend, overall market strength is vital. The falling market capitalization of SOL indicates continued control by sellers over the price.
Solana Price Analysis: One-Day Chart
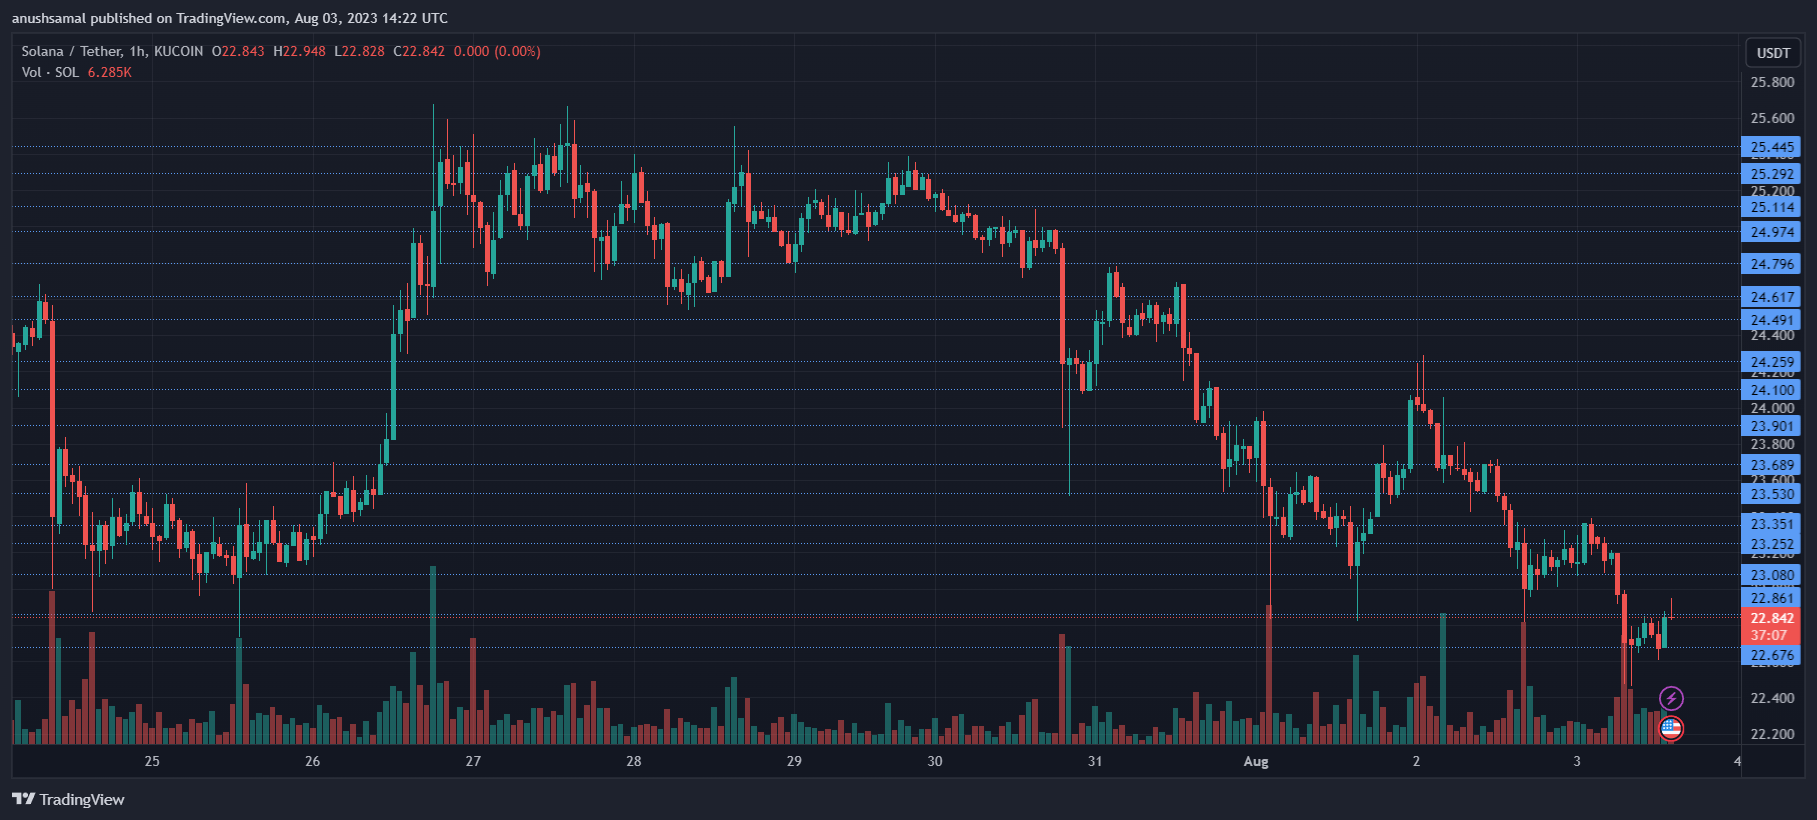
At the time of writing, SOL was trading at $22.80, demonstrating stability around a significant support zone. Although a drop from this level might attract buyers, there is a possibility that the altcoin could slip below the $20 mark. If buyers step in, the next resistance levels would be $23 and $25.
Once the $25 price mark is breached, Solana could aim for $30, signifying a potential 36% rally. However, SOL must avoid falling below $20, as that would nullify any bullish revival. In the last session, the volume of SOL traded declined, suggesting a decrease in buying strength.
Technical Analysis
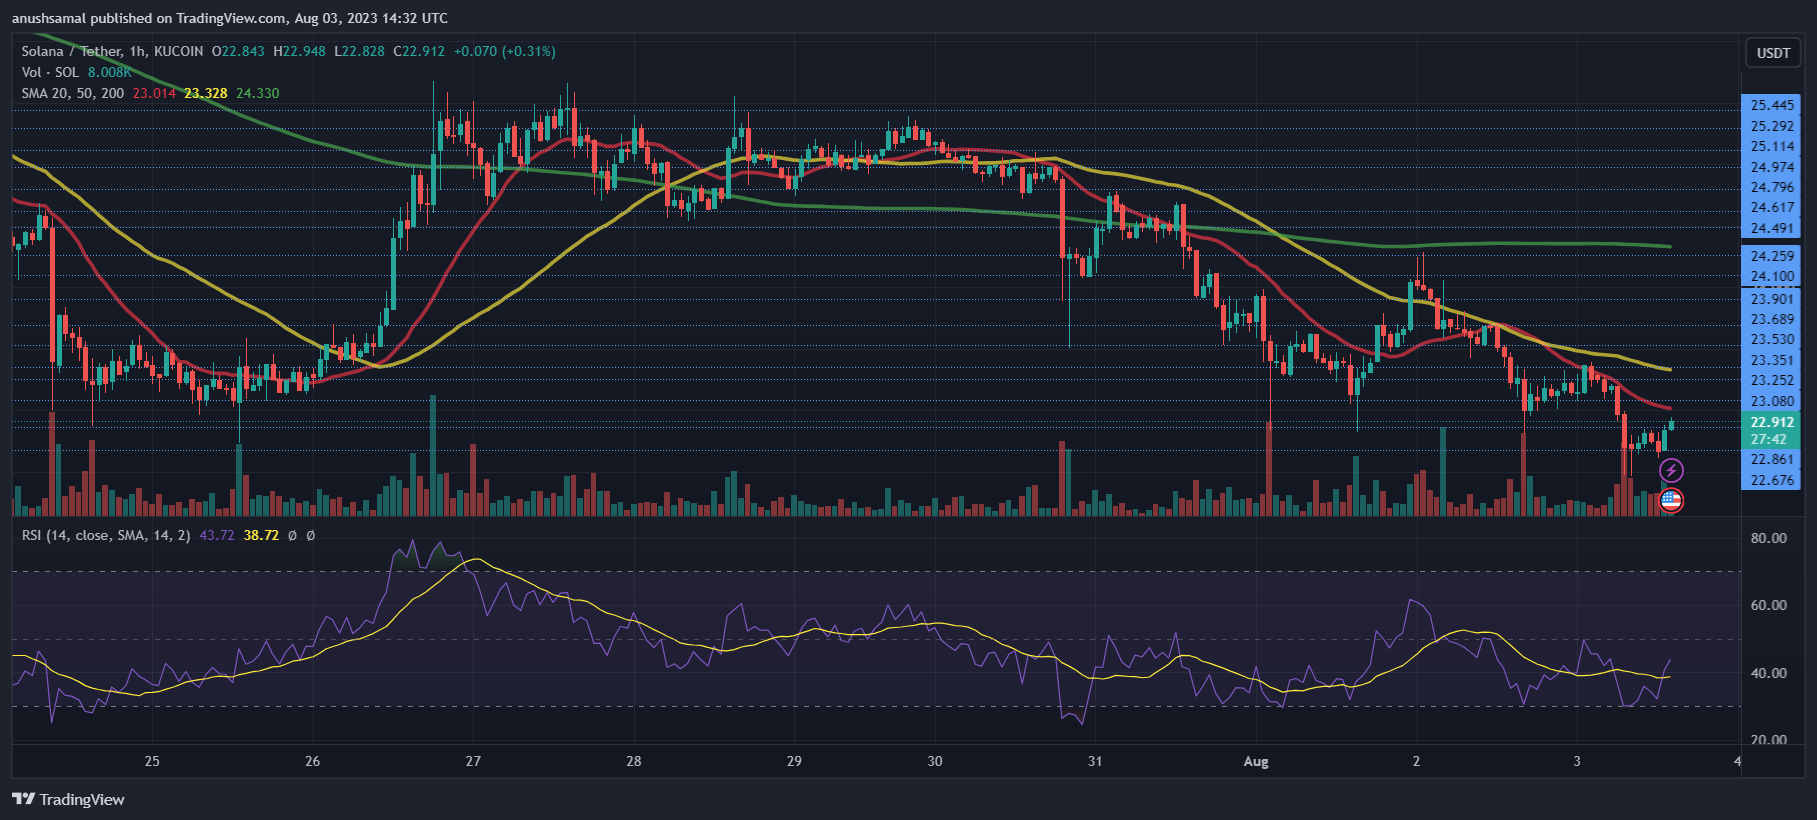
SOL showed increased selling pressure, indicating buyers had not yet entered the positive zone. The Relative Strength Index remained below the half-line, stressing the lack of bullish momentum as sellers outnumbered buyers at the time of observation.
Moreover, SOL was positioned below the 20-Simple Moving Average line, signifying a lack of demand at this level and further suggesting that sellers had control over the price momentum in the market. The upcoming trading sessions hold significance for the coin as buyers will determine the altcoin’s future direction.
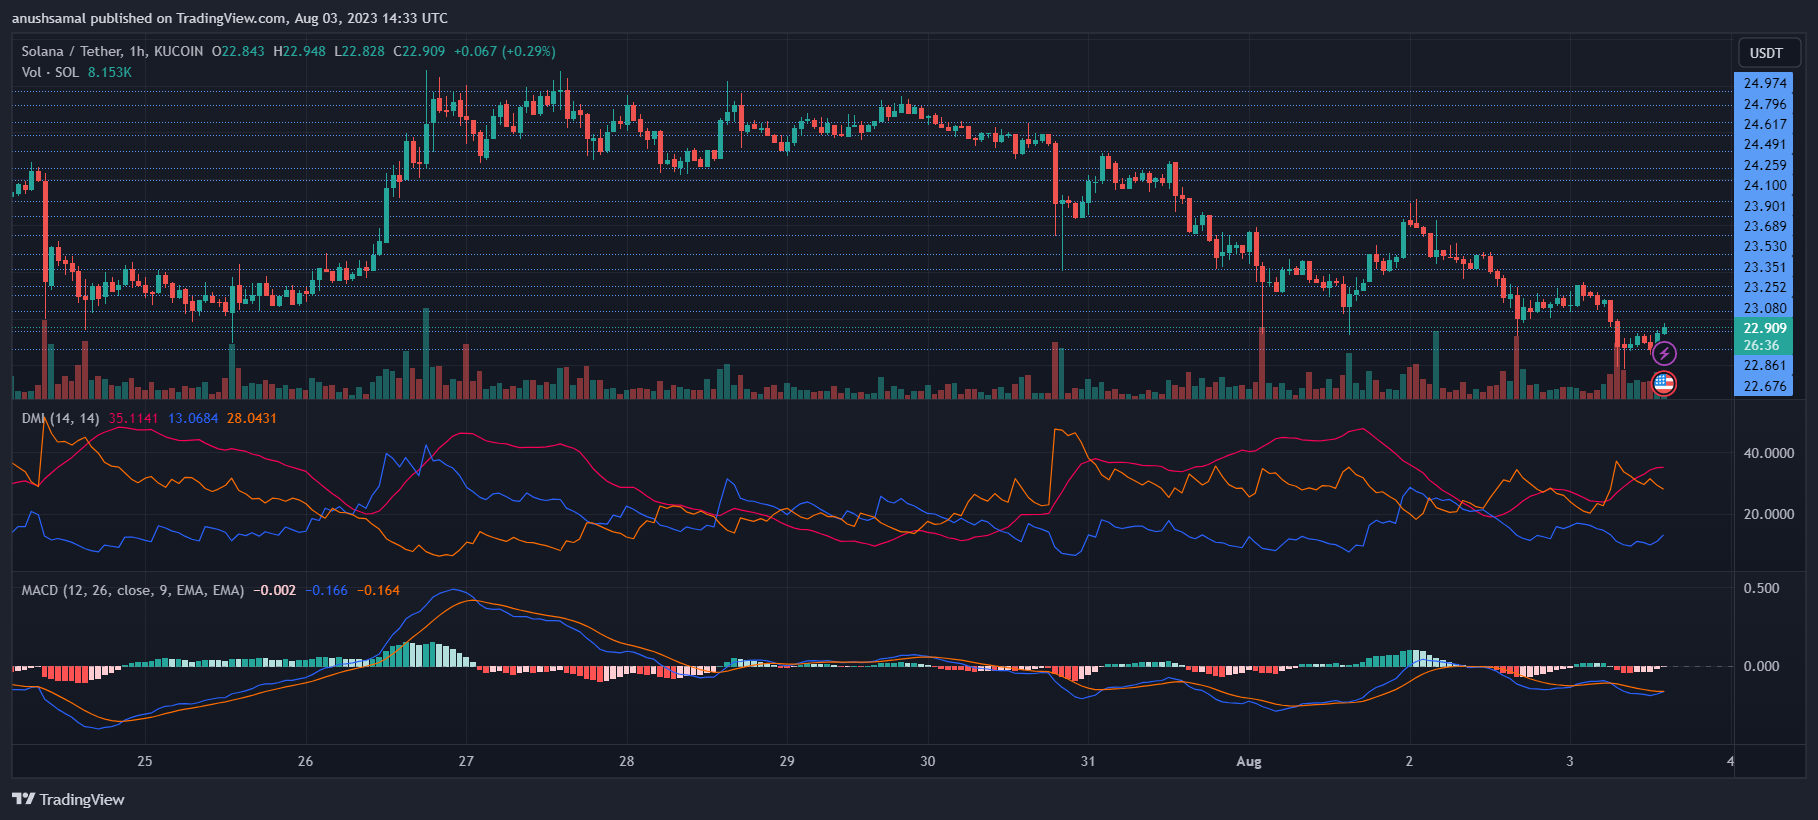
The altcoin’s low demand has led to the formation of sell signals. This indicated the continued dominance of bears in the market. However, it’s worth noting that the size of these sell signals is gradually decreasing.
The Moving Average Convergence Divergence (MACD) indicator, which measures price momentum and trend changes, showed red histograms. This reading was linked to sell signals. Despite this, the sell signals were relatively short, suggesting that the altcoin might see some buying strength in the upcoming trading sessions.
On the other hand, the Directional Movement Index (DMI), which indicates price direction, remained negative. The -DI line (orange) was positioned above the +DI line (blue).
Conversely, the Average Moving Index was above the 40 mark, indicating that a change in price direction could be expected in the next trading sessions.
Source: Read Full Article
-
Javier Milei's Battle for a Pro-Bitcoin Future in Argentina – Here's How It's Going – Coinpedia Fintech News
-
EOS Foundation urges creditors to reject $22M Block.one settlement
-
Bittrex challenges SEC's authority in crypto lawsuit, seeks dismissal
-
Grayscale Bitcoin Trust among ARK’s top ETF performers in Q2 2023
-
Improbable sells gaming venture for $97M, shares 2024 metaverse predictions