Earn Your First Bitcoin Sign up and get $12 Bonus Referral bonus up to $3,000
- Ripple price started a downside correction from the $0.4700 zone against the US dollar.
- The price is now trading above $0.44 and the 55 simple moving average (4 hours).
- There was a break above a key contracting triangle with resistance near $0.430 on the 4-hour chart of the XRP/USD pair (data source from Kraken).
- The pair could start a fresh increase above the $0.4700 resistance.
Ripple price is consolidating near $0.452 against the US Dollar, similar to Bitcoin. XRP price must stay above the $0.440 support to remain in a bullish zone.
Ripple Price Analysis
This past week, Ripple price saw a decent increase above the $0.4250 resistance against the US Dollar. The XRP/USD pair climbed above the $0.432 resistance to move into a positive zone.
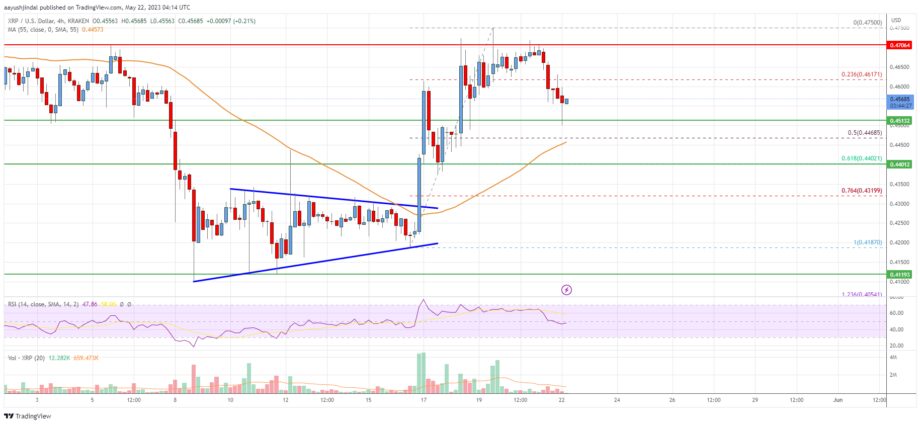
There was a break above a key contracting triangle with resistance near $0.430 on the 4-hour chart of the XRP/USD pair. The bulls even pumped the price above the $0.45 resistance. A high was formed near $0.4750 and the price recently corrected lower.
There was a move below the $0.470 and $0.465 levels. The bears pushed the price below the 23.6% Fib retracement level of the upward move from the $0.4187 swing low to the $0.4750 high.
The price is now trading above $0.44 and the 55 simple moving average (4 hours). It is trading above the 50% Fib retracement level of the upward move from the $0.4187 swing low to the $0.4750 high. On the upside, the price is facing resistance near $0.470.
The next major resistance is near the $0.4750 level. A close above the $0.4750 resistance zone might start a strong increase. In the stated case, the price could even surpass the $0.5000 resistance. Any more gains might send the price toward the $0.525 resistance.
Initial support on the downside is near the $0.451 level. The next major support is near the $0.4400 level. Any more losses could lead the price toward the $0.42 level, below which the price might even test $0.400.
Ripple Price
Looking at the chart, Ripple’s price is now trading above the $0.44zone and the 55 simple moving average (4 hours). Overall, the price could start a fresh increase above the $0.4700 resistance.
Technical indicators
4 hours MACD – The MACD for XRP/USD is now gaining momentum in the bearish zone.
4 hours RSI (Relative Strength Index) – The RSI for XRP/USD is near the 50 level.
Key Support Levels – $0.4510, $0.4400, and $0.4200.
Key Resistance Levels – $0.4700 and $0.4750.
Source: Read Full Article
-
Singapore's financial watchdog pushes back against Terra and 3AC associations
-
Binance applies to deregister in Cyprus, says focus is on 'larger markets'
-
Mark Cuban, OpenSea Investor, Challenges Decision on Creator Royalties
-
‘Thank God’ El Salvador doesn’t have any Bitcoin on FTX, CZ clarifies
-
Cardano DEX MuesliSwap to refund users after slippage confusion


