Cryptocurrency analysts of Coinidol.com report, Quant (QNT) is trading in an area at the bottom of the chart.
Quant price long term forecast: bearish
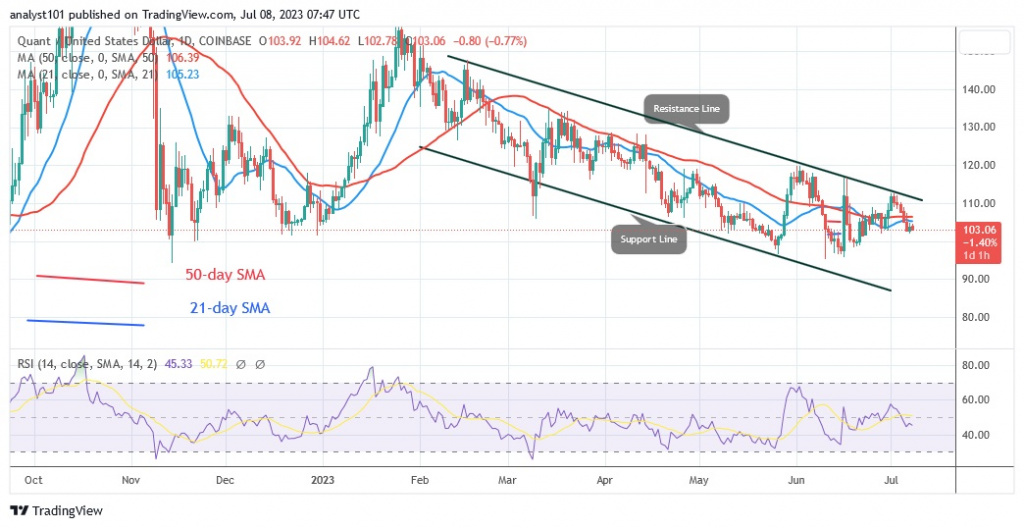
In the past two months, the cryptocurrency asset has been trading at the bottom of the chart. The price of the altcoin is between $95 and $120. The barrier at $120 has stopped the upward movement.
If the resistance level is broken, the altcoin will trend upwards. On the downside, the bulls have defended the current support level above $95. As the altcoin resumes its sideways trend, Quant has reached bearish exhaustion. Further selling pressure is unlikely as the altcoin consolidates above the current support.
Quant price indicator analysis
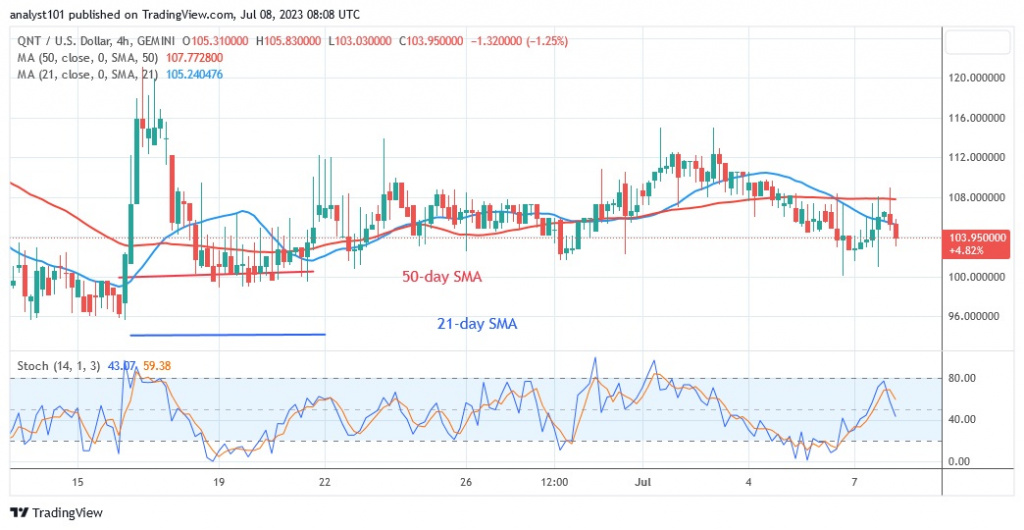
QNT has fallen below the moving average lines and is now at the 47 level on the period 14 Relative Strength Index. As the altcoin maintains its horizontal trend, the price bars oscillate below and above the moving average lines. The daily stochastic is currently above the level of 40 and thus bullish.
Technical indicators
Key supply zones: $140, $150, $160
Key demand zones: $90, $80, $70
What is the next move for Quant?
QNT/USD will remain in a trading range as long as the current resistance and support levels remain intact. The cryptocurrency has fallen below the moving average lines. Further gains are capped below the $110 high. If the altcoin falls below the current support, it could rally.
On Jul 04, 2023, Coinidol.com reported that: Since May 26, selling pressure has eased and the cryptocurrency has resumed its sideways movement. The altcoin was trading between $96 and $116.
Disclaimer. This analysis and forecast are the personal opinions of the author and are not a recommendation to buy or sell cryptocurrency and should not be viewed as an endorsement by CoinIdol.com. Readers should do their own research before investing in funds.
Source: Read Full Article
-
Ark Invest Expects Bitcoin to Become a Multitrillion-Dollar Market — Predicts BTC Price Could Reach $1.48 Million – Markets and Prices Bitcoin News
-
SBF claims innocence, contradicts other witnesses: Law Decoded
-
Bitcoin Price Aims Fresh Increase To $31K, This Support Is The Key
-
Jak koupit bitcoin in Prague?
-
Best Ways to Earn Passive Income with Crypto in 2023


