Cryptocurrency price analysis brought by Coinidol.com. Polygon (MATIC) price is declining and trading in a narrow range.
Long-term forecast of the Polygon price: fluctuation range
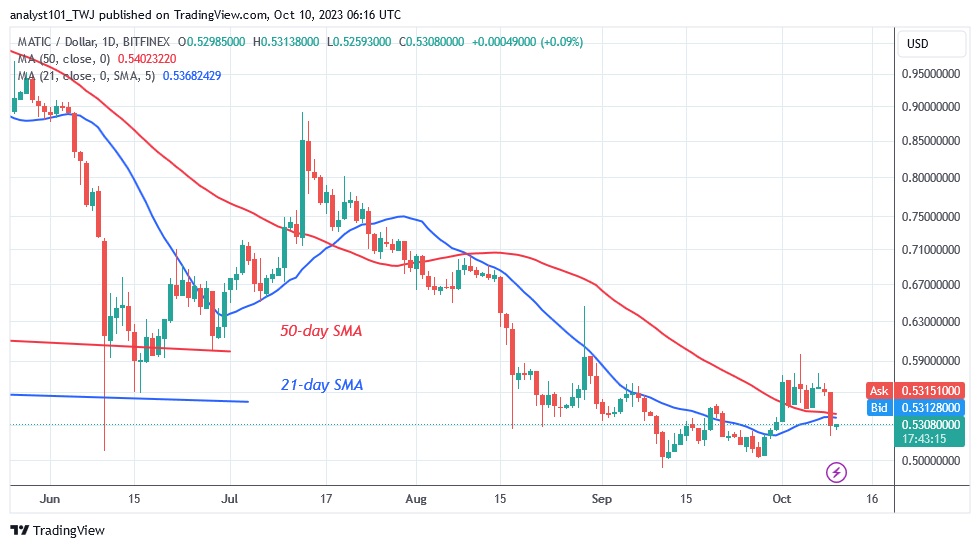
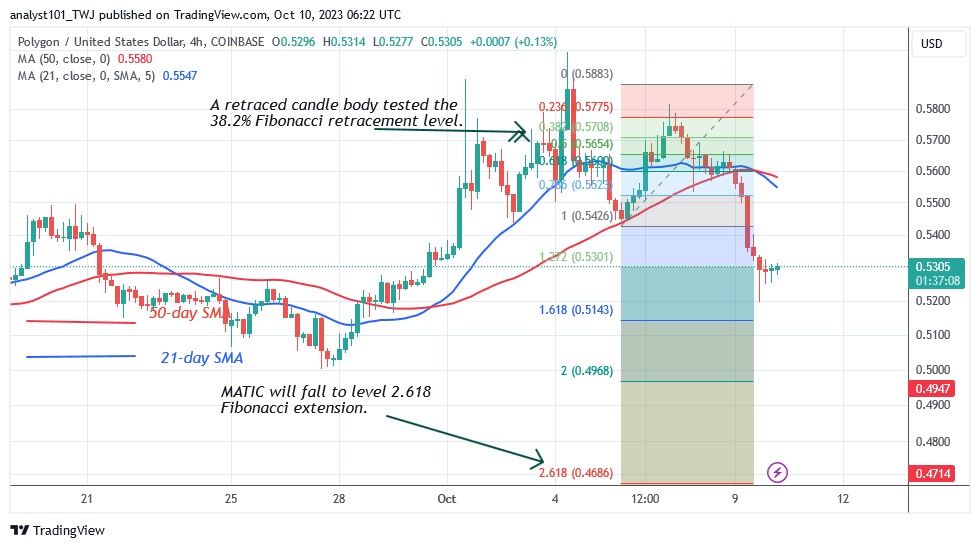
In the last 48 hours, MATIC rose above the moving average lines but encountered resistance at $0.58. The altcoin has retreated below the moving average lines. In other words, the price of MATIC/USD is trading in a range between $0.50 and $0.58. At press time, the altcoin had fallen to a low of $0.53. The altcoin tends to fall further as long as the price bars are below the moving average lines. If the support of $0.50 is breached, the cryptocurrency asset will fall to a low of $0.46. However, if the existing support holds, the movement will continue within the range.
Polygon indicator analysis
The cryptocurrency value is currently trading in a bearish trend zone as the price is below the moving average lines. The conclusion is that the altcoin is more likely to fall than to rise. The downward slope of the moving average lines indicates a decline. The oversold area of the market is where the altcoin is trading now.
Technical indicators
Resistance levels: $1.20, $1.30, $1.40
Support levels: $0.60, $0.40, $0.30
What is the next move for Polygon?
Polygon has been trading sideways since the price drop on June 10. The cryptocurrency’s value dropped to around $0.50, but the bulls bought the dips. The altcoin rose to a high of $0.89, but encountered fierce resistance. Today’s low of Polygon’s price is $0.53. The price indicator predicts that MATIC will continue to fall until it reaches a low of $0.46.
Last week Coinidol.com reported that on June 10, the cryptocurrency value exceeded $0.50 and ended its fall. Bulls pushed the price to $0.89 by buying the dips.
Disclaimer. This analysis and forecast are the personal opinions of the author and are not a recommendation to buy or sell cryptocurrency and should not be viewed as an endorsement by CoinIdol.com. Readers should do their research before investing in funds.
Source: Read Full Article
-
Bitcoin Bears Gains Strength – Is This Renewed Downtrend or Just Correction
-
Hotbit Exits CEX Market Amid Declining Exchange Trading Volumes
-
Bitcoin Holds And Consolidates Below $23,000 Mark
-
CoinShares' Demirors Predicts Nail-Biting Bearish Storm Ahead For Bitcoin, Ether, Cardano, Solana
-
FTX reportedly hacked as officials flag abnormal wallet activity


