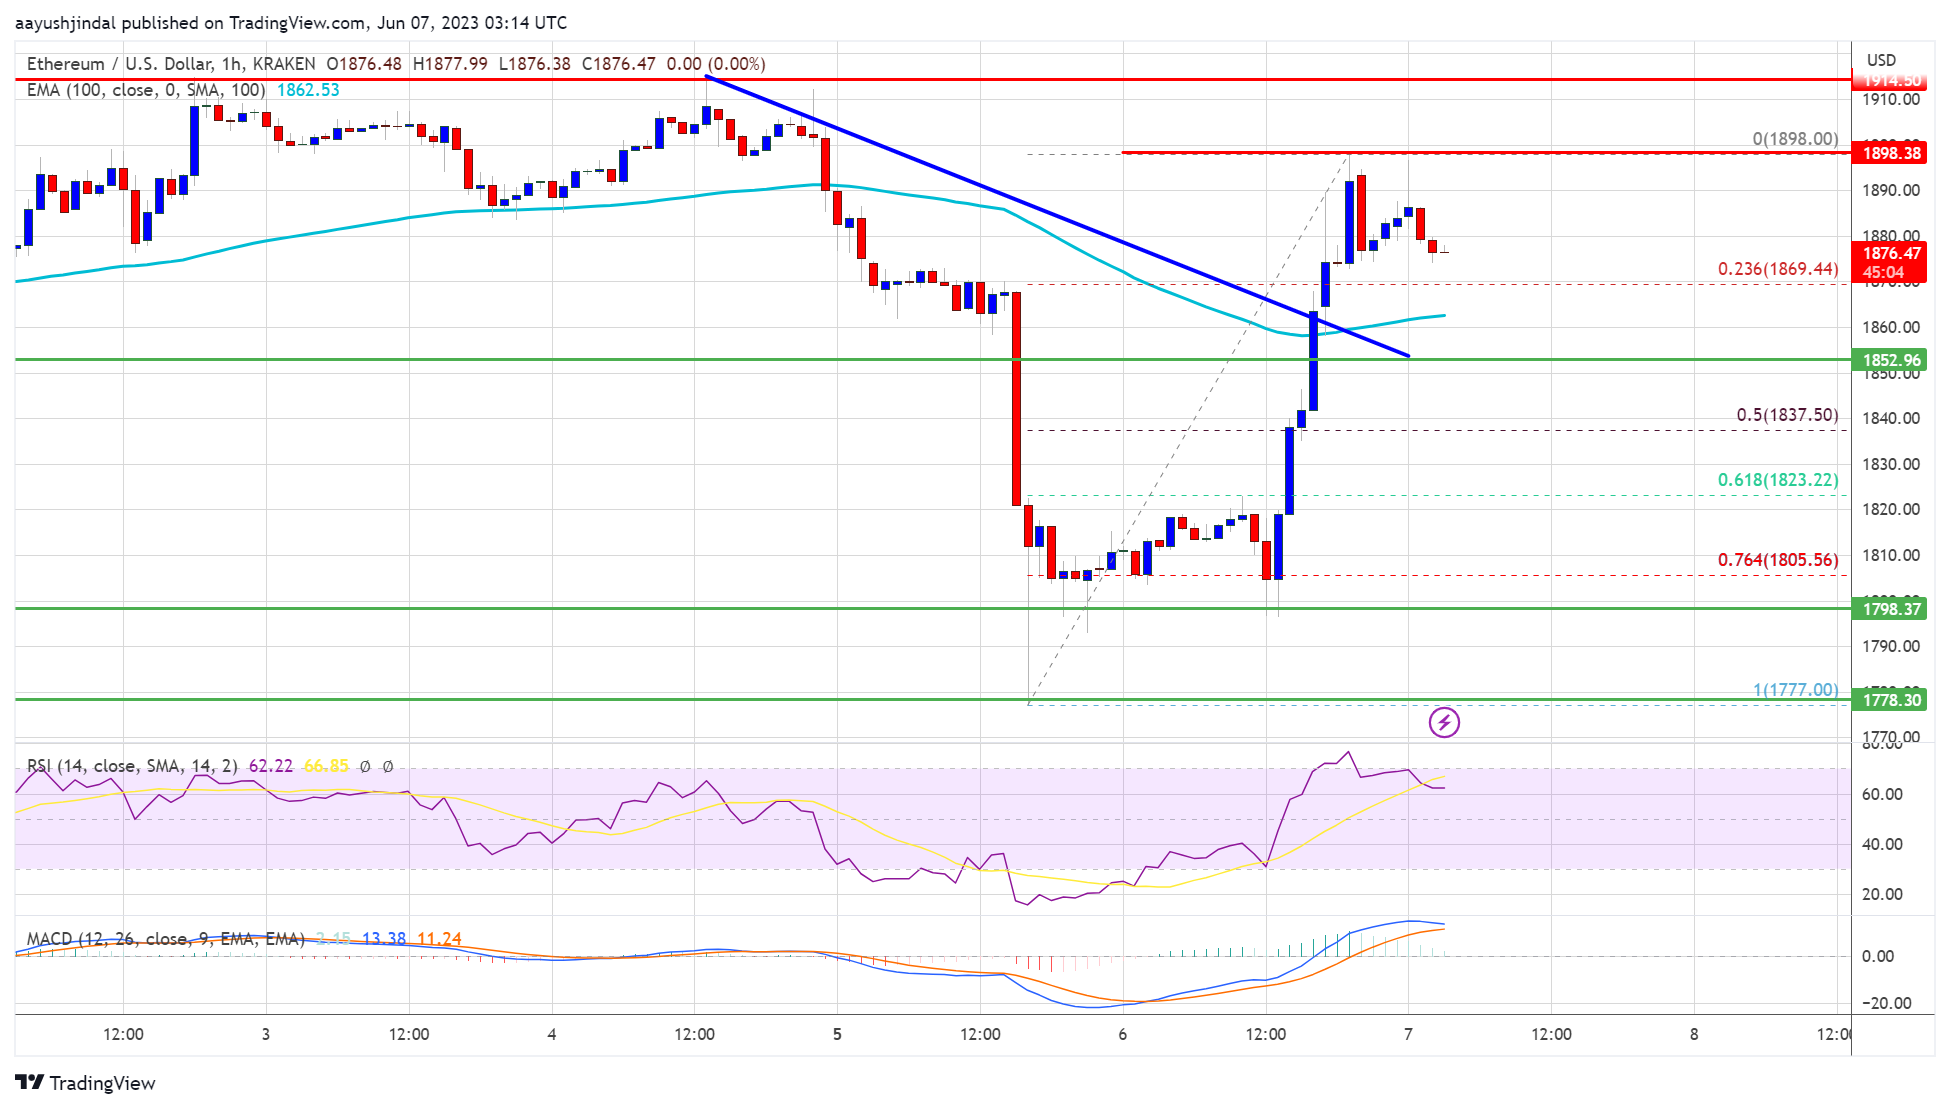
Ethereum price recovered losses and traded above $1,860 against the US Dollar. ETH must clear $1,920 to start a strong increase in the near term.
- Ethereum is showing positive signs above the $1,860 level.
- The price is trading above $1,850 and the 100-hourly Simple Moving Average.
- There was a break above a key bearish trend line with resistance near $1,865 on the hourly chart of ETH/USD (data feed via Kraken).
- The pair could still struggle to clear the $1,920 resistance zone.
Ethereum Price Trims Losses
Ethereum’s price found support near the $1,775 zone after a major decline. ETH formed a base and started a fresh increase above the $1,800 resistance zone, similar to Bitcoin.
There was a clear move above the $1,840 and $1,850 resistance levels. Besides, there was a break above a key bearish trend line with resistance near $1,865 on the hourly chart of ETH/USD. A high is formed near $1,898 and the price is now consolidating gains.
Ether is now trading above $1,850 and the 100-hourly Simple Moving Average. It is also above the 23.6% Fib retracement level of the recent increase from the $1,777 swing low to the $1,898 high.
Source: ETHUSD on TradingView.com
Immediate resistance is near the $1,900 zone. The next major resistance is near the $1,920 level (a multi-touch zone). A proper move above the $1,900 and $1,920 resistance levels might send Ether toward $1,950. The next resistance sits near $2,000, above which Ethereum could rise toward $2,040. Any more gains above the $2,040 resistance zone might send the price toward the $2,120 resistance.
Fresh Decline in ETH?
If Ethereum fails to clear the $1,900 resistance, it could start another decline. Initial support on the downside is near the $1,860 level and the 100-hourly Simple Moving Average.
The next major support is near the $1,840 zone or the 50% Fib retracement level of the recent increase from the $1,777 swing low to the $1,898 high. If there is a break below the $1,840 support, the price could decline toward the $1,800 support. Any more losses may perhaps send the price toward the $1,775 level or even $1,740 in the coming sessions.
Technical Indicators
Hourly MACD – The MACD for ETH/USD is losing momentum in the bullish zone.
Hourly RSI – The RSI for ETH/USD is above the 50 level.
Major Support Level – $1,840
Major Resistance Level – $1,920
Source: Read Full Article
-
Binance looks to the UK for regulation amid US crypto crackdown
-
SEC alleges fintech and 'market maker' firms manipulated crypto market in token scheme
-
Ethereum Price Analysis: ETH At Risk of Drop Below $1K
-
Kenya Halts Worldcoin Signups Citing Public Safety
-
Bitcoin Price Corrects But Uptrend Is Still Intact and BTC Could Rally Again


