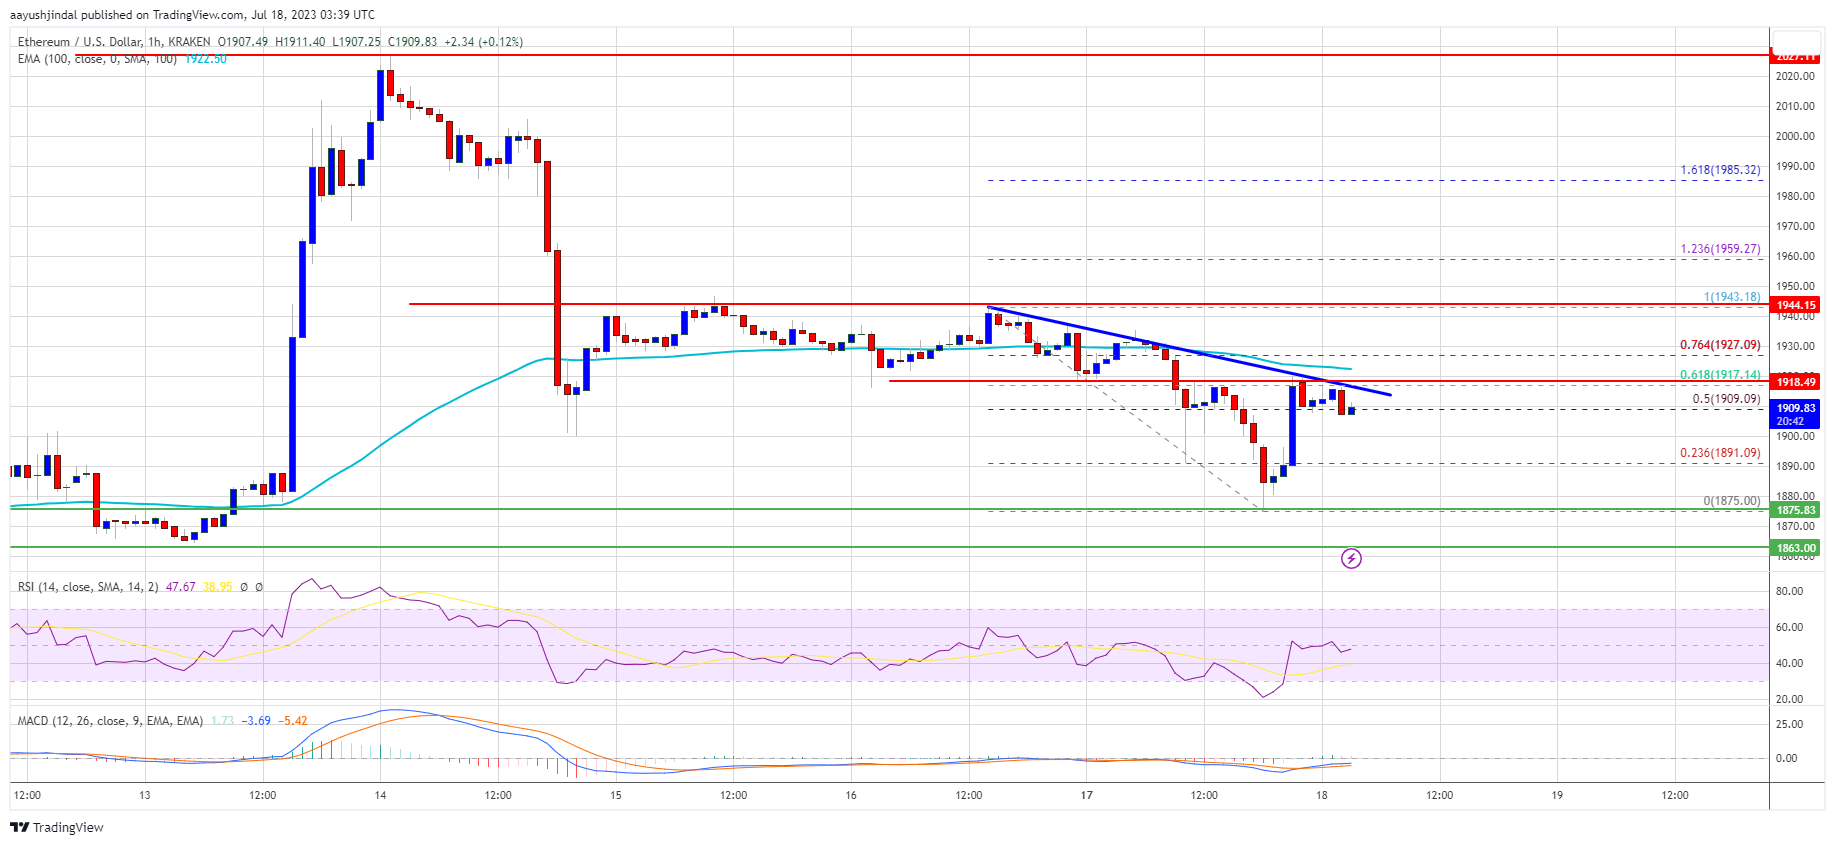
Ethereum price corrected further lower below the $1,900 level against the US Dollar. ETH is showing bearish signs and might decline further toward $1,825.
- Ethereum extended its decline and tested the $1,875 level.
- The price is trading below $1,930 and the 100-hourly Simple Moving Average.
- There is a connecting bearish trend line forming with resistance near $1,910 on the hourly chart of ETH/USD (data feed via Kraken).
- The pair could decline further if it stays below the $1,910 and $1,940 resistance levels.
Ethereum Price Could Extend Losses
Ethereum’s price made a fresh attempt to start a decent increase above the $1,950 resistance. However, ETH struggled to gain strength for a move above $1,950.
A high was formed near $1,943 and the price reacted to the downside. There was a break below the $1,900 support zone. A new weekly low is formed near $1,875 and the price is now attempting a fresh increase. It broke the $1,890 and $1,900 levels.
There was a move above the 50% Fib retracement level recent decline from the $1,943 swing high to the $1,875 low. Ether is now trading below $1,930 and the 100-hourly Simple Moving Average.
On the upside, immediate resistance is near the $1,910 level. There is also a connecting bearish trend line forming with resistance near $1,910 on the hourly chart of ETH/USD. The trend line is near the 61.8% Fib retracement level recent decline from the $1,943 swing high to the $1,875 low.
Source: ETHUSD on TradingView.com
The first major resistance is near the $1,950 zone, above which the price could rise toward the $1,985 resistance zone. The next major resistance is near the $2,030 level. Any more gains could send Ether toward the $2,120 resistance or even $2,200.
More Losses in ETH?
If Ethereum fails to clear the $1,910 resistance, it could start a fresh decline. Initial support on the downside is near the $1,890 level.
The first major support is near the $1,875 level, below which the price could extend its decline. The next major support is near the $1,825 support level. Any more losses could send Ether toward the $1,780 support level in the near term.
Technical Indicators
Hourly MACD – The MACD for ETH/USD is losing momentum in the bearish zone.
Hourly RSI – The RSI for ETH/USD is now below the 50 level.
Major Support Level – $1,875
Major Resistance Level – $1,910
Source: Read Full Article
-
Perfect storm for undervalued ASICs: Blockstream plans $50M raise to buy miners
-
Bitcoin ETFs have 75% chance of approval this year: Bloomberg analysts
-
Ethereum co-founder responds to PoS critics amid upcoming Merge
-
Here’s what happened to Arbitrum post-airdrop
-
Bitcoin Bollinger Bands Are The Tightest Ever, What Happens Next?


