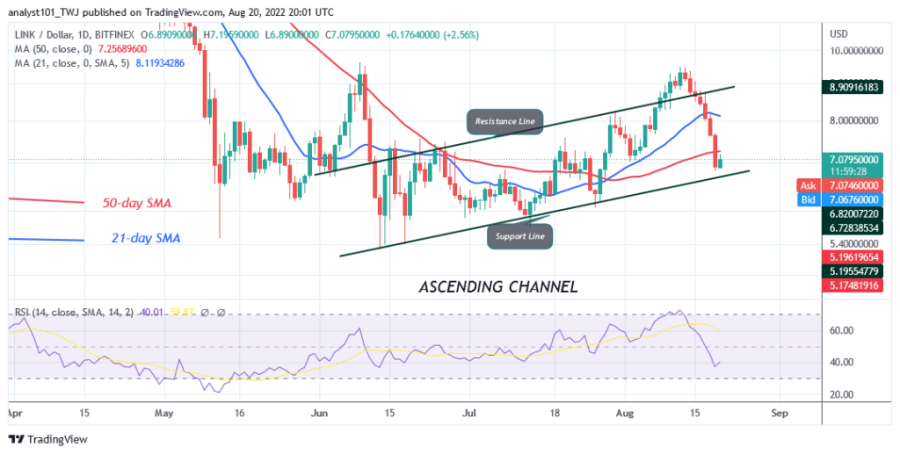
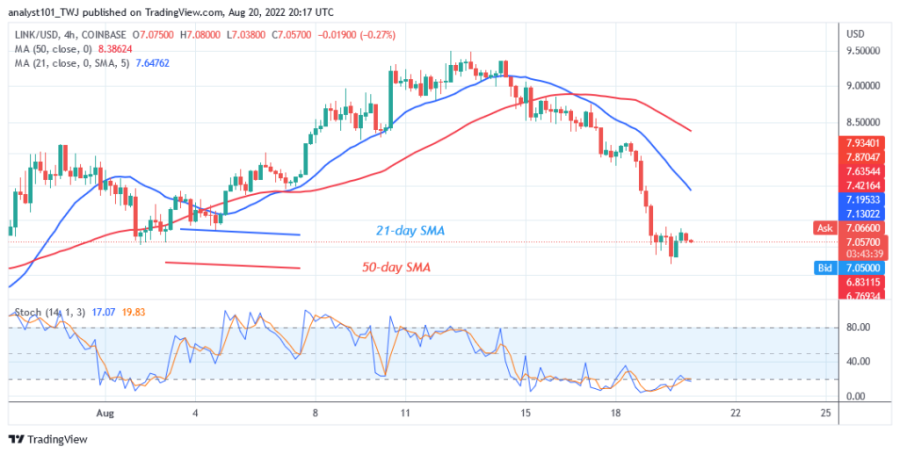
Chainlink (LINK) is now in a downward correction as the price falls below the moving average lines. The cryptocurrency falls from the high of $9.47 to the low of $6.82.
The bottom line is that the altcoin risks further decline as the price bars fall below the moving average lines. The current support at $6.82 is the historical price from August 2. On August 2, the current support held as the cryptocurrency rallied to the high of $9.50. If the bears break below the current support today, the market will continue to fall to the low price level of $5.70. Chainlink is trading at $7.19 at the time of writing.
Chainlink indicator reading
Chainlink is at level 37 of the Relative Strength Index for period 14. The cryptocurrency is in the downtrend zone due to the recent drop to the previous lows. The cryptocurrency’s price bars are below the moving average lines, indicating a further decline. The altcoin is below the 20% area of the daily stochastic. This means that the market has reached the oversold zone.
Technical indicators
Key Resistance Zones: $10, $12, $14
Key Support Zones: $9, $7, $5
What is the next move for Chainlink?
Chainlink is in a downtrend after the recent breakdown. However, as the market reaches the oversold zone, selling pressure is likely to ease. Buyers are expected to lift the price to the previous highs.
Disclaimer. This analysis and forecast are the personal opinions of the author and are not a recommendation to buy or sell cryptocurrency and should not be viewed as an endorsement by Coin Idol. Readers should do their own research before investing funds.
Source: Read Full Article
-
Shiba Inu Leaves Bitcoin Behind In A Week Of Price Surges
-
Crypto Twitter explodes over the news of Sam Bankman-Fried's arrest
-
Bitcoin Traders Are Trying to Cope with Massive Losses
-
Ongoing Solana-based wallet hack has already seen millions drained
-
Bleak Dogecoin Social Sentiment Raises Questions About Price


