Earn Your First Bitcoin Sign up and get $12 Bonus Referral bonus up to $3,000
- ADA price seems to be recovering above the $0.25 level against the US Dollar.
- The price is now trading below $0.288 and the 55 simple moving average (4 hours).
- There was a break above a major bearish trend line with resistance near $0.260 on the 4-hour chart (data feed via Coinbase).
- The price could gain bullish momentum if it clears the $0.265 and $0.288 levels.
Cardano price is recovering higher above $0.25 against the US Dollar, similar to Bitcoin. ADA price could gain bullish momentum if it clears the $0.265 resistance.
Cardano Price Analysis
Earlier this month, Cardano price saw a major decline from well above $0.320 against the US Dollar. The ADA/USD pair traded below the $0.30 and $0.288 support levels to move into a bearish zone.
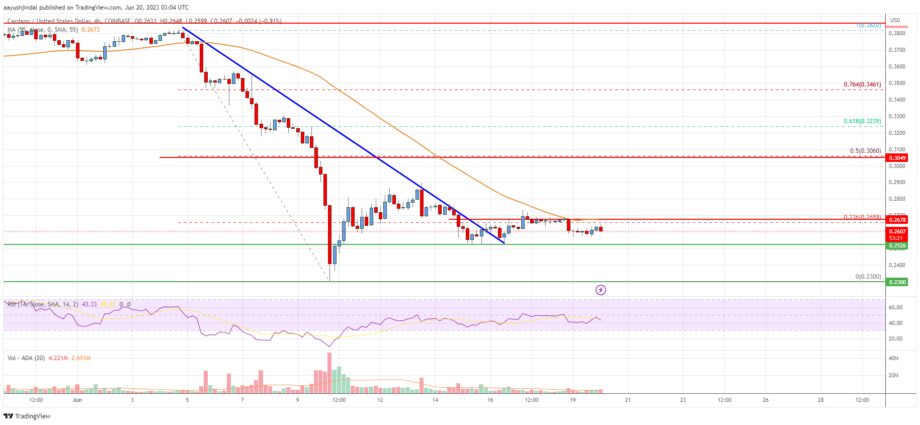
The bears even pushed the price below $0.25. A low is formed near $0.230 and the price is now correcting losses. There was a move above the $0.250 and $0.255 resistance levels. The price climbed above the 23.6% Fib retracement level of the key decline from the $0.3821 swing high to the $0.2300 low.
Besides, there was a break above a major bearish trend line with resistance near $0.260 on the 4-hour chart. ADA price is now trading below $0.288 and the 55 simple moving average (4 hours).
On the upside, immediate resistance is near the $0.265 zone. The next major resistance is near the $0.288 level. A clear move above the $0.288 resistance might start a steady increase. In the stated case, the price may perhaps rise toward the $0.300 resistance or the 50% Fib retracement level of the key decline from the $0.3821 swing high to the $0.2300 low.
On the downside, immediate support is near the $0.252 level. The next major support is near the $0.250 level. A clear move below the $0.250 level might send the price toward the $0.230 level. Any more losses might send the price toward the $0.205 support, below which the bears could aim for a test of $0.200.
Cardano (ADA) Price
The chart indicates that ADA price is now trading below $0.288 and the 55 simple moving average (4 hours). Overall, the price could gain bullish momentum if it clears the $0.265 and $0.288 levels.
Technical Indicators
4 hours MACD – The MACD for ADA/USD is now losing pace in the bullish zone.
4 hours RSI – The RSI for ADA/USD is now below the 50 level.
Key Support Levels – $0.252 and $0.230.
Key Resistance Levels – $0.265 and $0.288.
Source: Read Full Article
-
Playdapp & Mikey NFT Stands Out In The Bustling NFT Marketplace And Gets Sold Out Within Three Hours
-
‘Cardano Has Hit an AlternativeRank™ of 1 Out of the Top 3,954 Coins’, Says Analytics Firm LunarCrush
-
GRNGrid secures 50 million USD investment Commitment from GEM Digital
-
Elon Musk Floats Charging All X Users Subscription Fees To Combat Bots — Dogecoin To Play A Huge Part?
-
Crypto ATM market value to hit $472 million by 2027 per new data


