
BNB price (Binance coin) is recovering above $240 against the US Dollar. The price might gain bullish momentum if it clears $260 and $270.
- Binance coin price is attempting a recovery wave above $240 against the US Dollar.
- The price is now trading below $260 and the 100 simple moving average (4 hours).
- There is a key bullish trend line forming with support near $242 on the 4-hour chart of the BNB/USD pair (data source from Binance).
- The pair might struggle to gain bullish momentum above $260 and $270.
Binance Coin Price Faces Resistance
In the past few days, BNB price saw a major decline below the $260 support. There was a move below the $250 support zone, sparking bearish moves in Bitcoin and Ethereum.

The price even dived toward the $220 support. A low is formed near $220.6 and the price is now attempting a recovery wave. There was a move above the $240 resistance. The price climbed above the 23.6% Fib retracement level of the key decline from the $317.0 swing high to the $220.6 low.
The price is now consolidating below $260 and the 100 simple moving average (4 hours). There is also a key bullish trend line forming with support near $242 on the 4-hour chart of the BNB/USD pair.
On the upside, BNB is facing resistance near the $254 level. The next major resistance is near $260 and the 100 simple moving average (4 hours). The main resistance is now forming near $268 and the 50% Fib retracement level of the key decline from the $317.0 swing high to the $220.6 low.
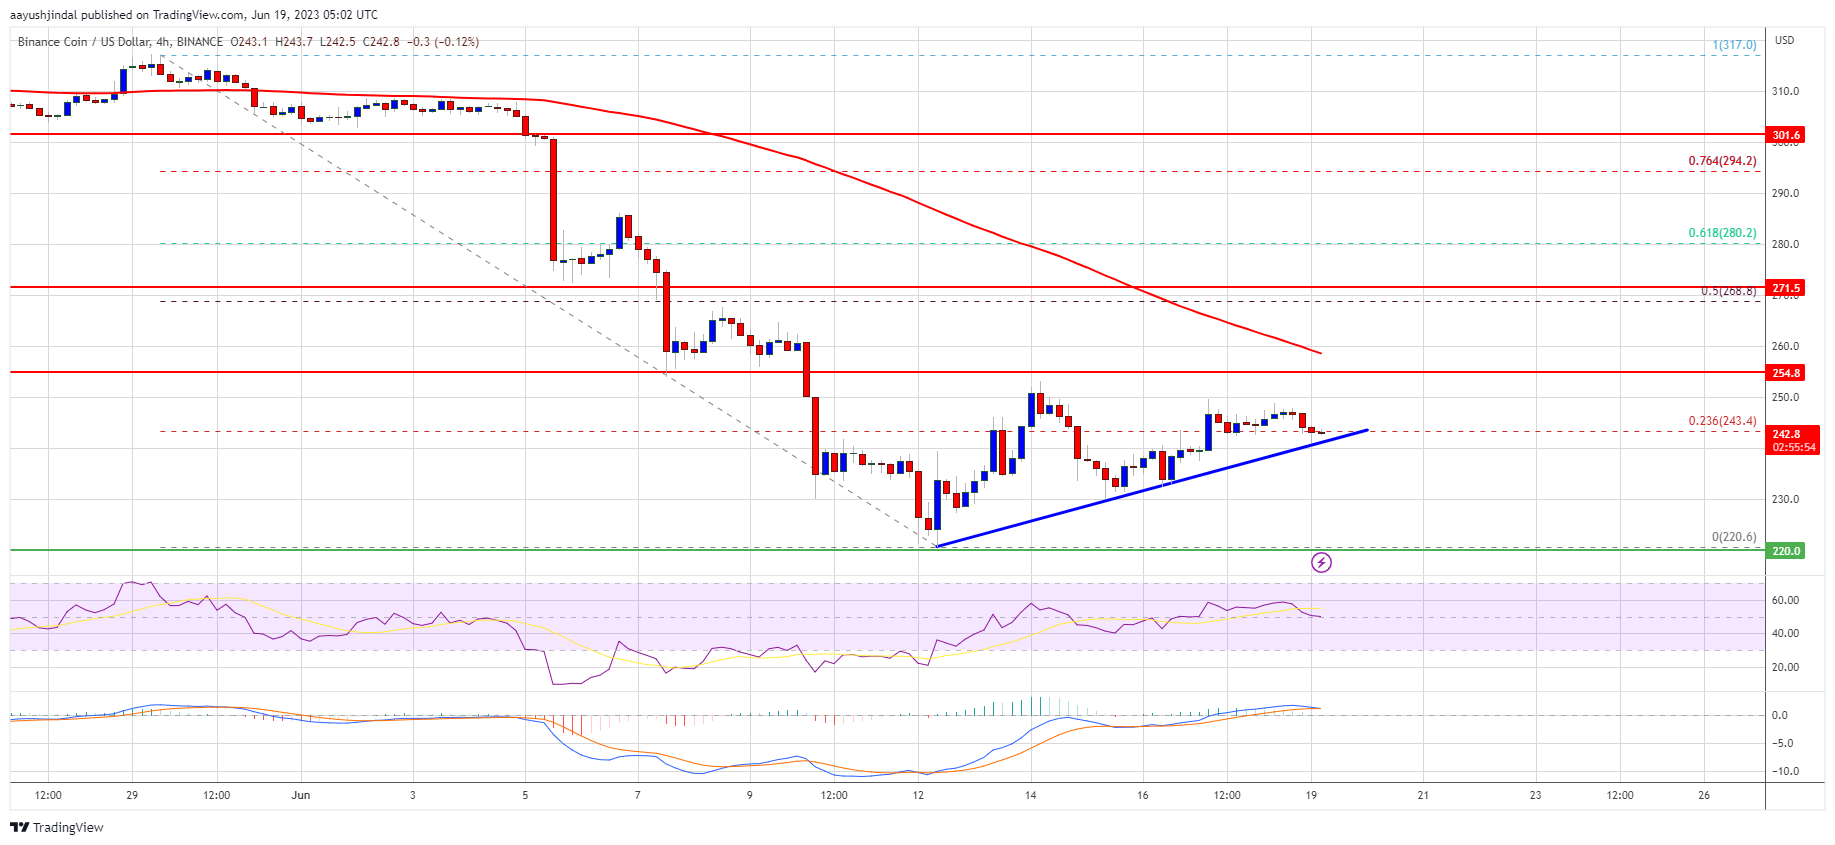
Source: BNBUSD on TradingView.com
A clear move above the $260 resistance and $268 might start a steady increase. The next major resistance is near the $280 level, above which the price might rise toward the $300 resistance.
Fresh Decline in BNB?
If BNB fails to clear the $260 resistance, it could start another decline. Initial support on the downside is near the $242 level and the trend line.
The next major support is near the $230 level. If there is a downside break below the $230 support, the price could revisit the $220 support. Any more losses could send the price toward the $200 support.
Technical Indicators
4-Hours MACD – The MACD for BNB/USD is losing pace in the bullish zone.
4-Hours RSI (Relative Strength Index) – The RSI for BNB/USD is currently above the 50 level.
Major Support Levels – $242, $230, and $220.
Major Resistance Levels – $260, $268, and $270.
Source: Read Full Article
-
Spain's Crypto Crackdown: Declaration of Foreign Holdings Made Mandatory! – Coinpedia Fintech News
-
Argentine Presidential Hopeful Taken To Court Over Alleged Cryptocurrency Ponzi Scam
-
How Soon Can We Expect Aave To Target $80?
-
BlockFi emerges from bankruptcy and opens wallet withdrawals
-
$ADA: COTI CEO on Why Cardano-Powered Stablecoin $DJED Did Not Lose Its Peg Last Week