
Bitcoin price started a fresh increase above the $28,000 resistance. BTC must clear $28,500 and $28,800 resistance levels to continue higher.
- Bitcoin climbed higher and was able to test the $28,550 resistance zone.
- The price is trading above $28,200 and the 100 hourly Simple moving average.
- There was a break above a major bearish trend line with resistance near $28,000 on the hourly chart of the BTC/USD pair (data feed from Kraken).
- The pair could extend its increase if it clears the $28,550 resistance level.
Bitcoin Price Clears Resistance
Bitcoin price remained well-bid above the $27,700 support zone. BTC formed a base and was able to climb again above the $28,000 resistance zone.

There was a clear move above the $28,200 resistance zone and the 100 hourly Simple moving average. Besides, there was a break above a major bearish trend line with resistance near $28,000 on the hourly chart of the BTC/USD pair.
The pair tested the $28,550 resistance zone. A high is formed near $28,548 and the price is now correcting lower. There was a move below the 23.6% Fib retracement level of the upward move from the $27,812 swing low to the $28,548 high.
However, Bitcoin’s price is now trading above $28,200 and the 100 hourly Simple moving average. Immediate resistance is near the $28,450 level. The next major resistance is near the $28,550 zone. A close above the $28,550 resistance might push the price higher toward the range resistance.
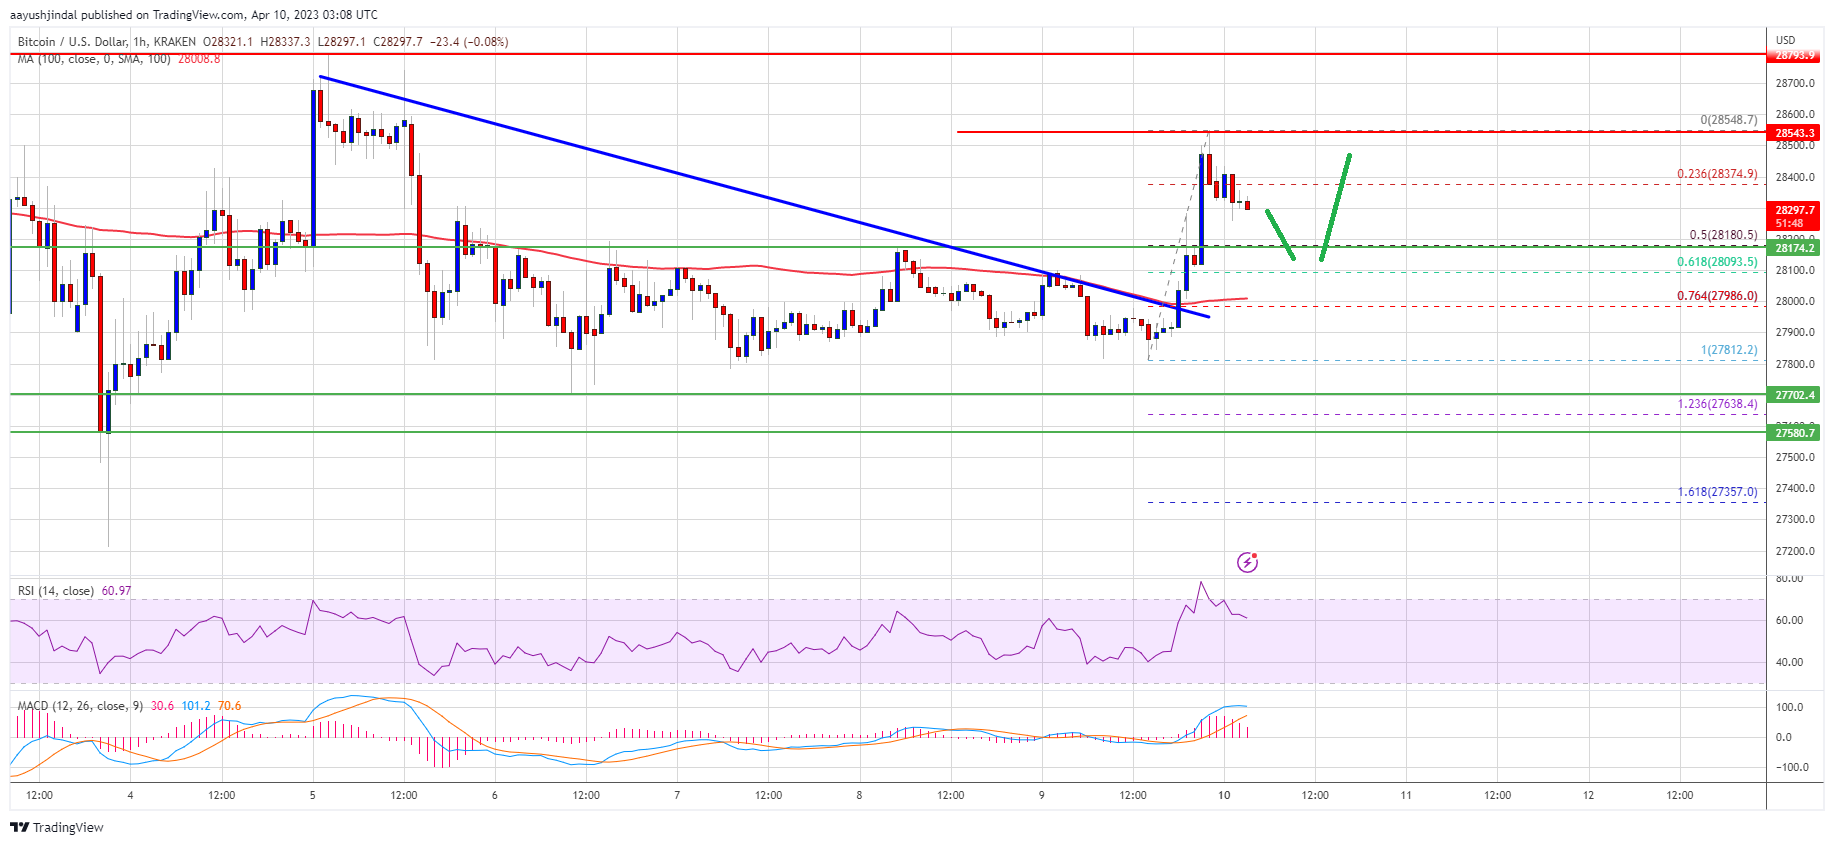
Source: BTCUSD on TradingView.com
The next key resistance is near the $28,800 level, above which the price could rise toward the $29,500 level. Any more gains might call for a test of the $30,000 resistance zone.
Fresh Decline in BTC?
If Bitcoin’s price fails to clear the $28,550 resistance, it could start another decline. Immediate support on the downside is near the $28,250 level.
The next major support is near the $28,200 zone and the 50% Fib retracement level of the upward move from the $27,812 swing low to the $28,548 high. A downside break and close below the $28,200 support might push the price back toward $27,700. In the stated case, the price may perhaps decline toward the $27,200 support zone.
Technical indicators:
Hourly MACD – The MACD is now losing pace in the bullish zone.
Hourly RSI (Relative Strength Index) – The RSI for BTC/USD is now above the 50 level.
Major Support Levels – $28,200, followed by $27,770.
Major Resistance Levels – $28,550, $28,800, and $29,500.
Source: Read Full Article
-
South Korean financial authorities solicit reports on unlicensed crypto exchanges
-
Bitcoin transaction fees flip Ethereum’s as Ordinals hype returns
-
Bitcoin Recovers After A Strong Rally To $23,962
-
Mirandus: Open World MMORPG Finally in Web3 – Press release Bitcoin News
-
Bittrex Woes Continue: Florida Regulator Says Exchange Violated Multiple Laws