Earn Your First Bitcoin Sign up and get $12 Bonus Referral bonus up to $3,000
- Bitcoin cash is attempting a recovery wave above the $100 resistance against the US Dollar.
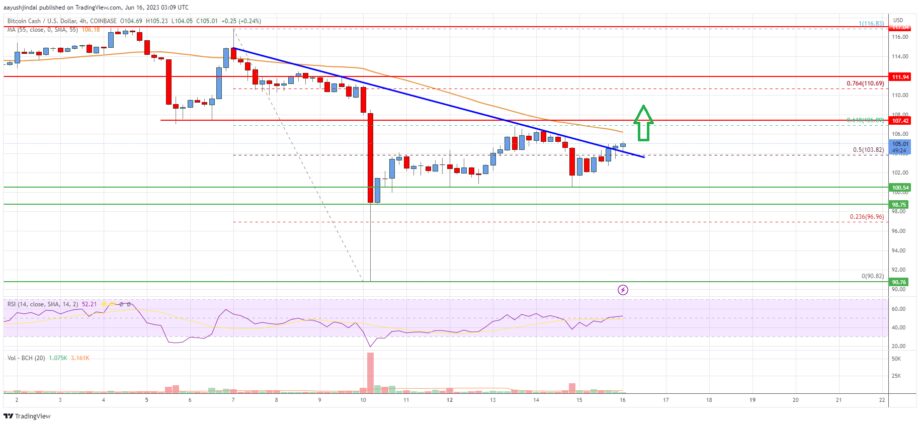
- The price is now trading below the $110 zone and the 55 simple moving average (4 hours).
- There was a break above a key bearish trend line with resistance near $105 on the 4-hour chart of the BCH/USD pair (data feed from Coinbase).
- The pair must clear $106 and $108 to continue higher in the near term.
Bitcoin cash price is consolidating above $100 against the US Dollar, similar to Bitcoin. BCH/USD could start a fresh surge if it clears the $108 level.
Bitcoin Cash Price Analysis

Bitcoin cash price formed a decent support base above the $95 level. BCH started a decent increase and was able to clear the $98 resistance zone.
The price climbed above the $100 and $102 resistance levels. There was a move above the 50% Fib retracement level of the downward move from the $116.83 swing high to the $90.82 low. Besides, there was a break above a key bearish trend line with resistance near $105 on the 4-hour chart of the BCH/USD pair.
It is now trading below the $110 zone and the 55 simple moving average (4 hours). On the upside, the price is facing resistance near the $106 level.
The next major resistance is near the $108 level or the 61.8% Fib retracement level of the downward move from the $116.83 swing high to the $90.82 low, above which the price may perhaps rise toward the $115 level. Any more gains above $115 could set the pace for a move toward the $120 level.
If not, the price might decline again. Immediate support on the downside is near the $102 level. The first major support sits near the $100 level. The next major support is near $95, below which the bears might aim for $90. The next target for them may perhaps be near the $88 level.

Bitcoin Cash Price
Looking at the chart, Bitcoin Cash’s price is now trading below the $110 zone and the 55 simple moving average (4 hours). Overall, the price must clear $106 and $108 to continue higher in the near term.
Technical indicators
4 hours MACD – The MACD for BCH/USD is gaining pace in the bullish zone.
4 hours RSI (Relative Strength Index) – The RSI for BCH/USD is above the 50 level.
Key Support Levels – $102 and $100.
Key Resistance Levels – $108 and $115.
Source: Read Full Article
-
More than $100M worth of NFTs stolen since 2021 — Elliptic
-
Crypto News for the Week Ahead! CPI, FOMC & More!
-
Is Cardano Out of the Woods Yet as Consolidation Continues?
-
Crypto self-custody a ‘fundamental human right’ but not risk-free: Community
-
OpenAI’s ChatGPT re-enters Italy after obliging transparency demands