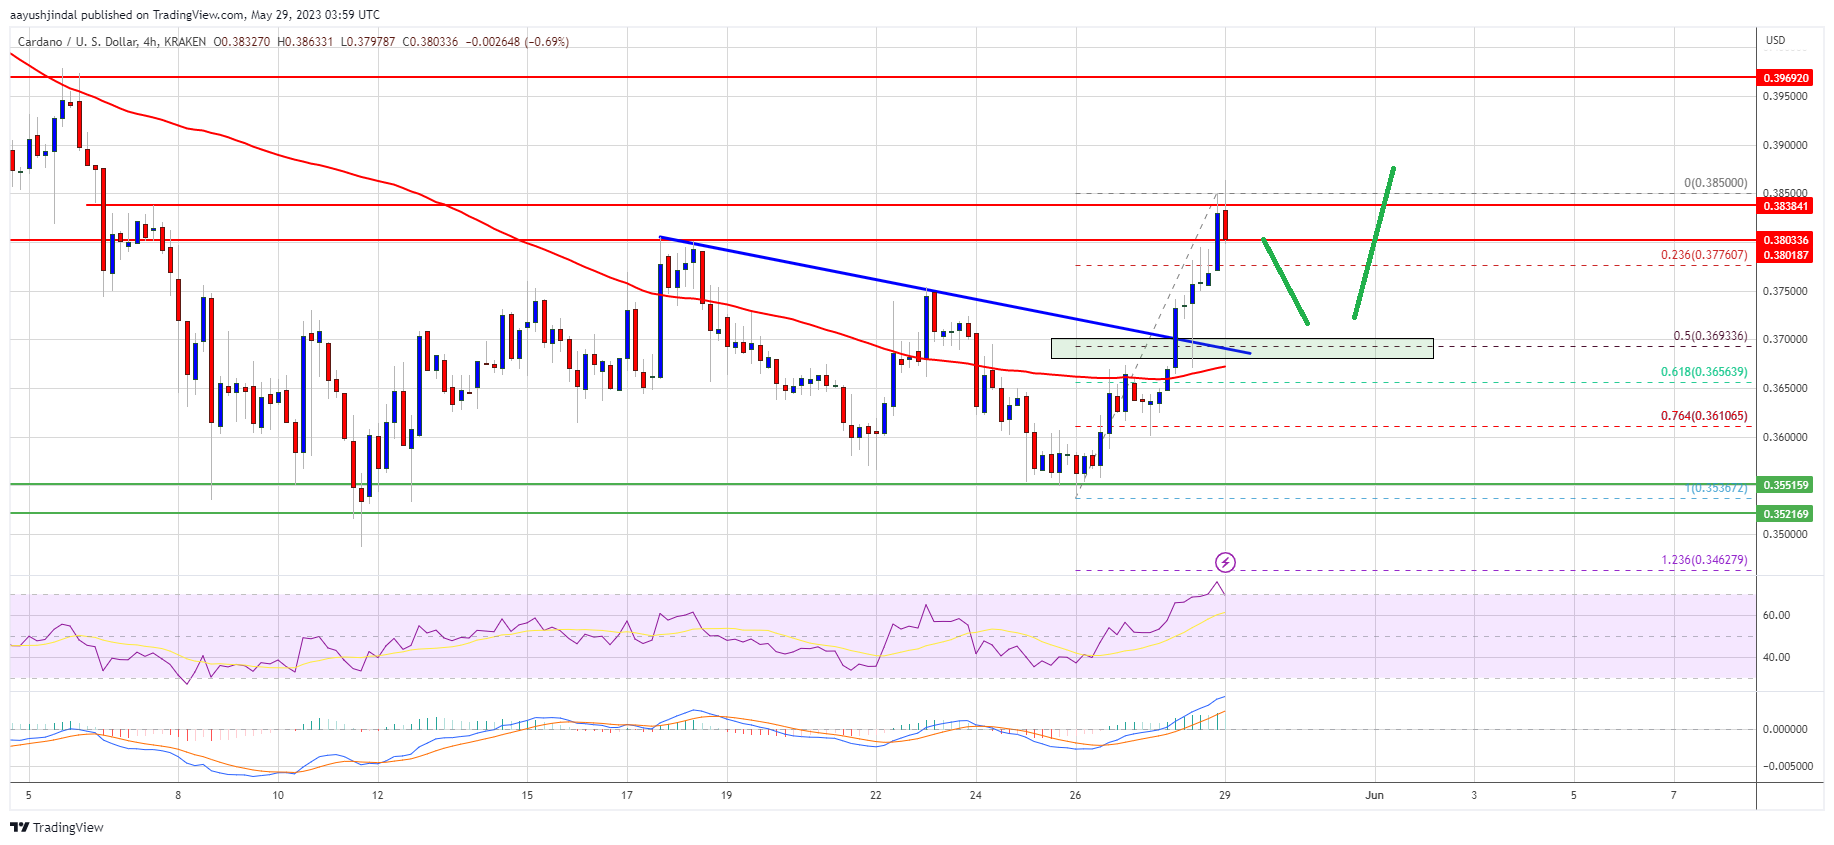
Cardano’s price is attempting a recovery wave above $0.375. ADA could gain bullish momentum if it settles above the $0.3850 resistance zone.
- ADA price is slowly moving higher from the $0.360 zone against the US dollar.
- The price is trading above $0.370 and the 100 simple moving average (4 hours).
- There was a break above a key bearish trend line with resistance near $0.369 on the 4-hour chart of the ADA/USD pair (data source from Kraken).
- The pair could start a decent increase if it settles above the $0.3850 resistance zone.
Cardano’s ADA Price Attempts Recovery
This past week, Cardano’s price declined toward the key $0.354 support zone. The bulls managed to stay in action and averted a major downside break below $0.3540.
A low was formed near $0.3536 and the price started a recovery wave. There was a move above the $0.365 and $0.375 resistance levels. Besides, there was a break above a key bearish trend line with resistance near $0.369 on the 4-hour chart of the ADA/USD pair.
The price is up 3% and showing a few positive signs, similar to Bitcoin and Ethereum. The bears are now protecting more gains above the $0.3850 resistance. A high is formed near $0.3850 and the price is consolidating gains. ADA price is trading above $0.370 and the 100 simple moving average (4 hours). It might soon test the 23.6% Fib retracement level of the recent wave from the $0.3536 swing low to the $0.3850 high.
Source: ADAUSD on TradingView.com
On the upside, immediate resistance is near the $0.385 zone. The next major resistance is forming near the $0.396 zone. If there is an upside break above the $0.385 and $0.396 resistance levels, the price could start a decent increase. In the stated case, the price could even surpass the $0.420 resistance zone. The next key resistance might be $0.432, above which it could test $0.45.
Fresh Decline in ADA?
If Cardano’s price fails to climb above the $0.385 and $0.396 resistance levels, it could start another decline. Immediate support on the downside is near the $0.375 level.
The next major support is near the $0.368 level or the 50% Fib retracement level of the recent wave from the $0.3536 swing low to the $0.3850 high. A downside break below the $0.368 level could open the doors for a fresh decline toward $0.354. The next major support is near the $0.332 level.
Technical Indicators
4 hours MACD – The MACD for ADA/USD is losing momentum in the bullish zone.
4 hours RSI (Relative Strength Index) – The RSI for ADA/USD is now above the 50 level.
Major Support Levels – $0.375, $0.368, and $0.354.
Major Resistance Levels – $0.385, $0.396, and $0.420.
Source: Read Full Article
-
Anatoly Yakovenko on DeFi's Disruptive Impact in Crypto and Traditional Finance
-
FATF's Crypto Travel Rule Impact on UK Crypto Transactions and Businesses
-
$AVAX: Amazon Web Services Partners With Avalanche To Deliver ‘Scalable Blockchain Solutions’
-
DeFi ‘circuit breaker’ could slash hack losses by 70%: Finance Redefined
-
SEC chair implies crypto exchanges may not be ‘qualified custodians’ as new rule is drafted


