Earn Your First Bitcoin Sign up and get $12 Bonus Referral bonus up to $3,000
- Stellar lumen price is rising toward the $0.120 resistance zone against the US Dollar.
- XLM price is now trading above $0.10 and the 55 simple moving average (4 hours).
- There is a key bullish trend line forming with support near $0.100 on the 4-hour chart (data feed via Kraken).
- The pair could start another increase if it clears the $0.115 and $0.120 resistance levels.
Stellar lumen price is trading above $0.10 against the US Dollar, similar to Bitcoin. XLM price must stay above the $0.120 support to rise further.
Stellar Lumen Price Analysis (XLM to USD)
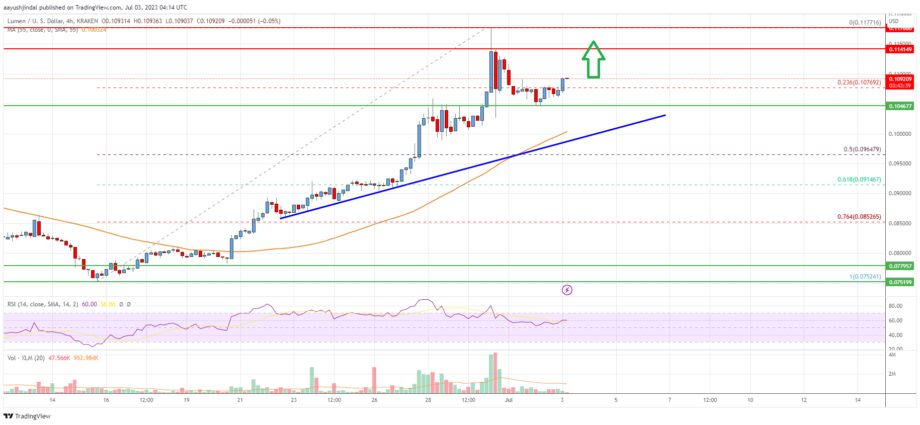
After forming a base above the $0.075 level, Stellar Lumen price started a fresh increase against the US Dollar. The XLM/USD pair broke the $0.088 resistance zone to move into a positive zone.
The price even cleared the $0.0950 resistance and the 55 simple moving average (4 hours). The upward move was such that the price spike to $0.1180 before the bears appeared. A high was formed near $0.1177 and the price is now consolidating gains.
XLM is now trading above $0.10 and the 55 simple moving average (4 hours). There is also a key bullish trend line forming with support near $0.100 on the 4-hour chart.
The price is also stable above the 23.6% Fib retracement level of the upward move from the $0.0752 swing low to the $0.1177 high. On the upside, the price is facing resistance near the $0.114 zone. The next major resistance is near the $0.118 level.
A clear move above the $0.118 level might send the price toward the $0.120 level. Any more gains could lead the price toward the $0.1250 level or even $0.1320 in the coming sessions.
Initial support on the downside is near the $0.100 level and the trend line. The next major support sits near the $0.0965 level or the 50% Fib retracement level of the upward move from the $0.0752 swing low to the $0.1177 high.
The main support is near the $0.092 zone. Any more losses could lead the price toward the $0.085 level in the near term.
Stellar Lumen (XLM) Price
The chart indicates that XLM price is now trading above $0.10 and the 55 simple moving average (4 hours). Overall, the price could start another increase if it clears the $0.114 and $0.12 resistance levels.
Technical Indicators
4 hours MACD – The MACD for XLM/USD is gaining momentum in the bullish zone.
4 hours RSI – The RSI for XLM/USD is now above the 50 level.
Key Support Levels – $0.100 and $0.0965.
Key Resistance Levels – $0.115, $0.120, and $0.132.
Source: Read Full Article
-
Digital identity platform integrates with zkSync for on-chain KYC
-
U.S. DOJ Vows To Beef Up Scrutiny Of Crypto Exchanges To Curb Illicit Behavior
-
Bosch, EU and blockchain companies to build decentralized IoT: IAA Mobility
-
Ethereum, Bitcoin users reignite scalability debate as gas fees surge
-
Binance CEO CZ deems SEC's request for emergency relief unwarranted


