
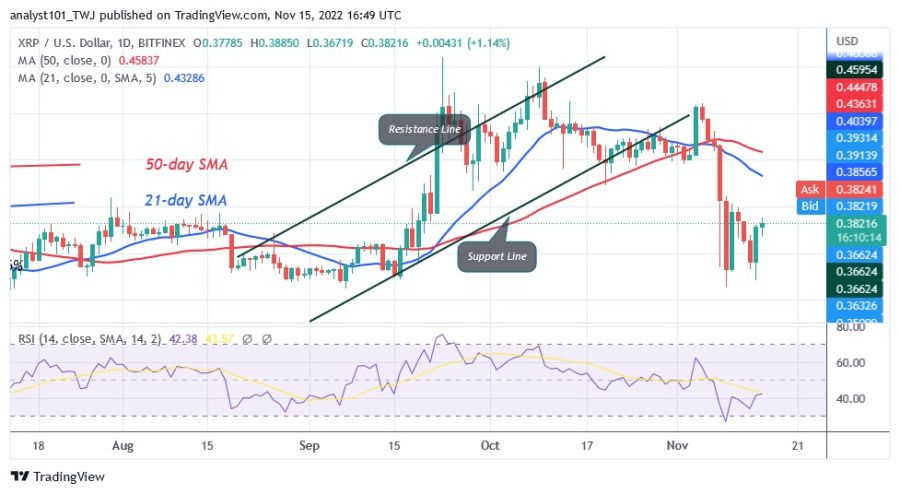
Ripple (XRP) is correcting upward to its previous highs after the recent slump. On November 10, XRP's upward correction paused around the $0.40 high. Initial resistance at $0.40 is being tested or broken by buyers today.
XRP experienced similar price movements on September 20 and 22, but recovered and reached a high of $0.55. XRP is rising and reached a high of $0.37 today. On the plus side, XRP will break through resistance at $0.40 and rise above the moving average lines if it bounces above the support level of $0.37. On the contrary, the altcoin will be forced to return to the existing price range between $0.31 and $0.40 if it drops from the recent high.
Ripple indicator analysis

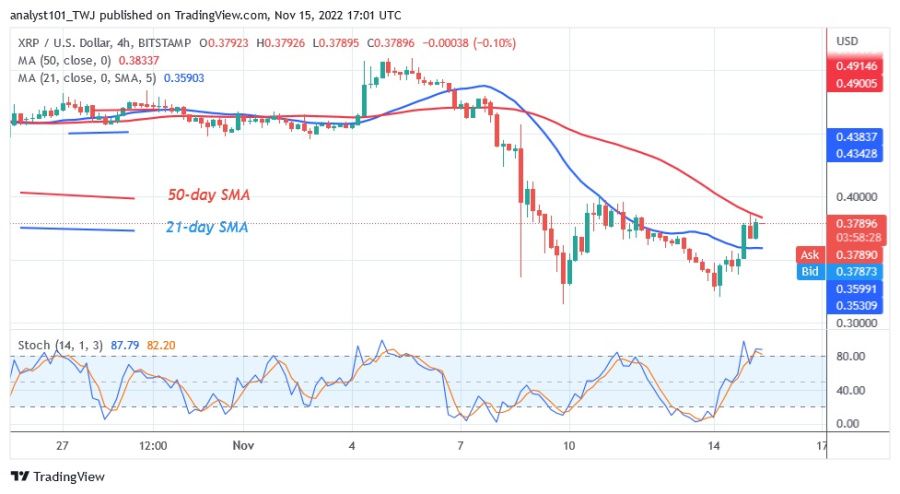
For the period 14, Ripple is at level 42 on the Relative Strength Index, which means that XRP is declining and could be so in the future. The daily stochastic is above the level of 80, which indicates that once XRP approaches the overbought area of the market, it is likely to start falling.
Technical indicators
Key resistance levels – $0.80 and $1.00
Key support levels – $0.40 and $0.20
What is the next move for Ripple?
XRP/USD is capped between the moving average lines on the 4-hour chart. The price of the cryptocurrency has also remained below the 50-day line SMA. This suggests that the altcoin will have a decline but will continue to trade sideways between the moving average lines.
Disclaimer. This analysis and forecast are the personal opinions of the author and are not a recommendation to buy or sell cryptocurrency and should not be viewed as an endorsement by CoinIdol. Readers should do their own research before investing.
Source: Read Full Article
-
Binance Coin Recovers As It Faces Drop To $300
-
Mustafa Gokiu Guilty of Running Illicit Crypto Business
-
BlackRock Dives Deeper into Crypto with $100K Seed Capital in Bitcoin ETF – Coinpedia Fintech News
-
Binance's indecision to freeze BNB wallets drew controversy in this $11M rug pull
-
DeFi sees exploits and exit scam drama in the last week of 2022: Finance Redefined