
Here are the pricing model lines that Bitcoin might have to stay above if the bullish momentum of the cryptocurrency has to continue.
These Bitcoin Pricing Models Are Currently Near The Spot Price
In a new tweet, the on-chain analytics firm Glassnode has pointed out how the three pricing models, the adjusted realized price, the short-term holder cost basis, and the 200-week MA, are all close to the asset’s value right now.

To understand the first and second models here, the “realized price” needs to be looked at first. The realized price is a pricing model derived from the realized cap, which is a capitalization model that assumes that the “real” value of each coin in the circulating supply is not the spot price, but the price at which it was last moved.
When this cap is divided by the total number of coins in circulation, the average cost basis or acquisition price in the market is obtained. This value, which the average holder on the network bought their coins at, is known as the realized price.
Now, the first pricing model, the “adjusted realized price,” is a modification of this indicator that drops from the data all holders who haven’t moved their coins since more than seven years ago.
Such old supply usually consists mostly of the coins that have been lost (perhaps due to the wallet keys no longer being accessible), which means that this part of the supply wouldn’t be relevant to the current market, hence why the indicator cuts it out.
As for the second model of interest here, the “short-term holder (STH) cost basis,” this metric keeps track of the realized price of specifically the investors who have been holding their coins since less than 155 days.
Here is a chart that shows how these Bitcoin pricing models have compared with the spot price during the past year:
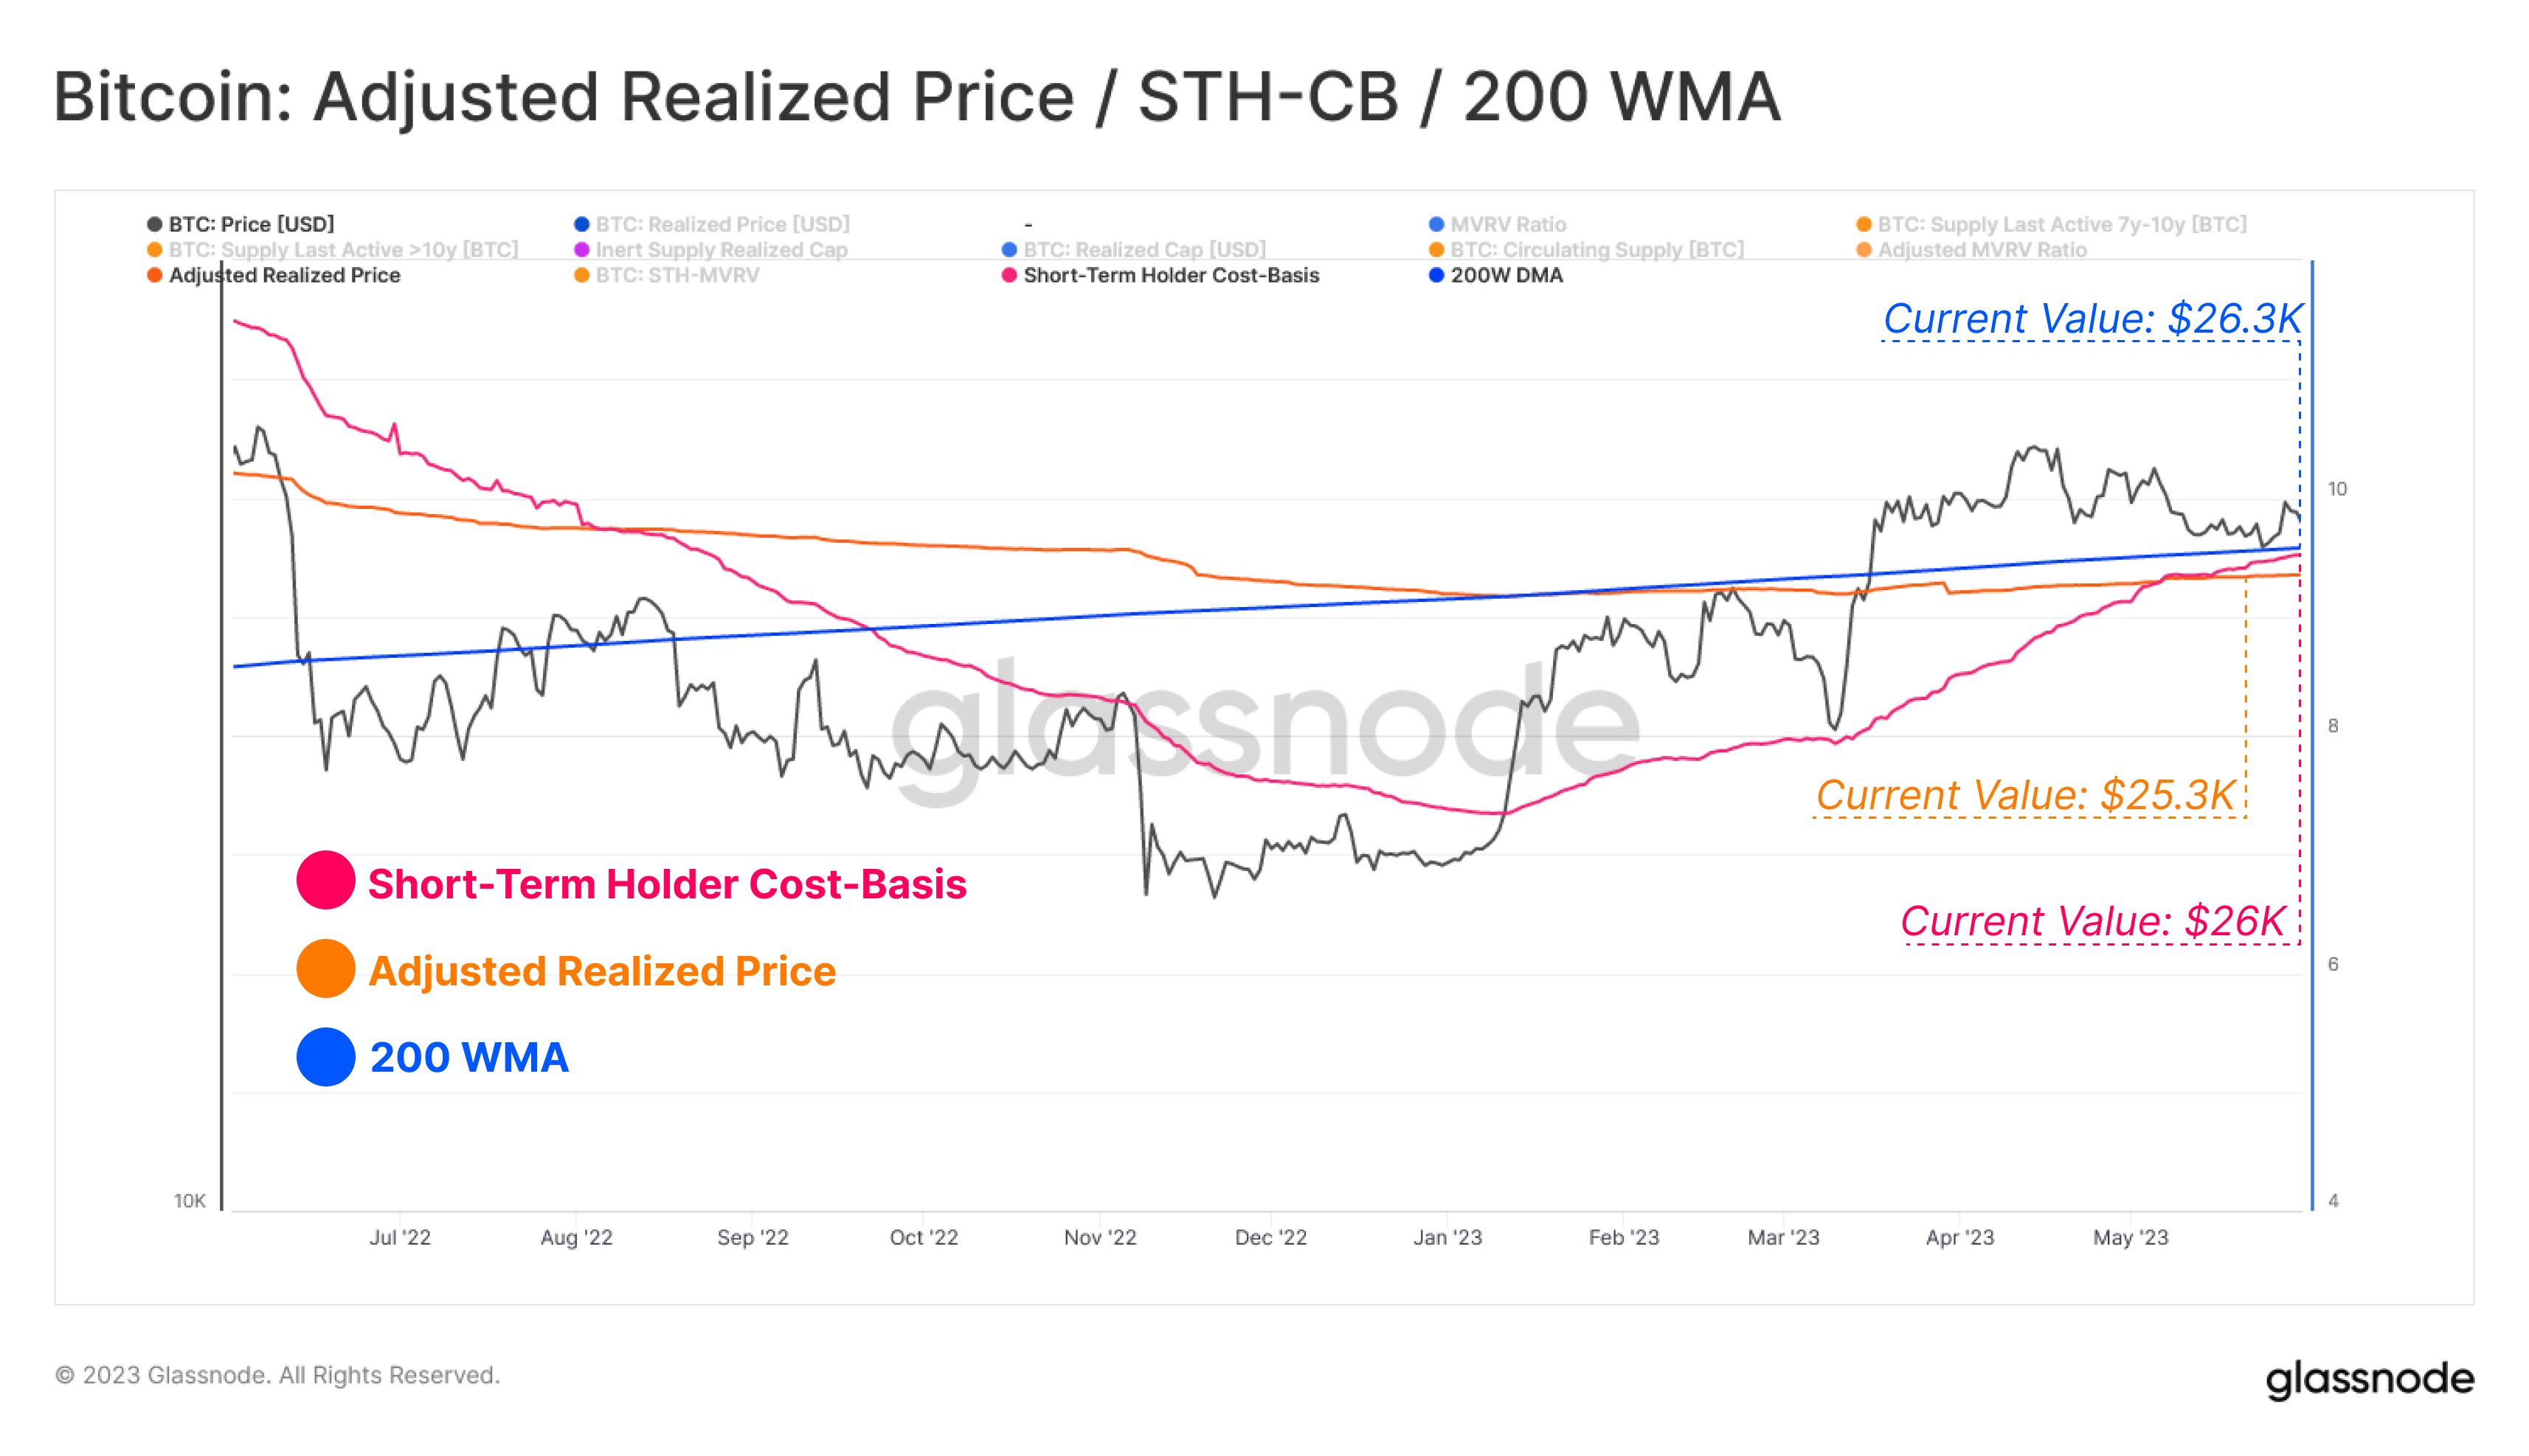
The price seems to be just above these models at the moment | Source: Glassnode on Twitter
As displayed in the above graph, the Bitcoin adjusted realized price currently has a value of $25,300, while the short-term holder cost basis has a value of $26,000.
Historically, these models have acted as both resistance and support for the price, depending on the wider trend. In bullish periods, they usually act as support so it’s possible that if the price drops deep enough to hit them, a rebound may happen.
The third line on the chart, the 200-week moving average (MA), is a model that aims to find the baseline momentum of the four year Bitcoin cycle. This line has also had some similar interactions with the price as the other two models.
The 200-week MA has a value of $26,300 right now, implying that it’s currently the closest line to the spot price. It now remains to be seen how the price interacts with these lines, starting with the 200-week MA, if a drawdown extended enough happens.
A successful retest of these lines would naturally be a positive sign for the rally, but a drop under them may be a signal that a transition back towards a bearish regime has occurred.
BTC Price
At the time of writing, Bitcoin is trading around $27,000, up 1% in the last week.

Source: Read Full Article
-
JP Morgan U-turns on Crypto
-
Fidelity Survey: Institutional Investors Plan To Buy More Bitcoin, Ether, And Other Cryptos
-
Traders Act Fast As Binance Australia Unveils Bitcoin Discount For Limited Period
-
Decentralized exchange PancakeSwap moves into GameFi
-
Bloomberg Analyst Lauds Bitcoin Energy Shift Amid Rising Hashrate