
Ethereum price is attempting a fresh increase from $1,825 against the US Dollar. ETH could rally if there is a clear move above the $1,900 resistance.
- Ethereum is currently attempting a recovery wave above the $1,855 zone.
- The price is trading above $1,865 and the 100-hourly Simple Moving Average.
- There is a major bearish trend line forming with resistance near $1,900 on the hourly chart of ETH/USD (data feed via Kraken).
- The pair could start a decent increase if there is a close above $1,900.
Ethereum Price Revisits Resistance
Ethereum’s price remained stable above the $1,825 support zone. ETH started a slow recovery wave and was able to climb a few points higher above $1,850, similar to Bitcoin.
The bulls were able to push the price above the 100-hourly Simple Moving Average. The price broke the 50% Fib retracement level of the key decline from the $1,955 swing high to the $1,825 low. However, the bears were seen active near the $1,900 resistance zone.
There is also a major bearish trend line forming with resistance near $1,900 on the hourly chart of ETH/USD. Ether is now trading above $1,865 and the 100-hourly Simple Moving Average.
Immediate resistance is near the $1,890 level. The first major resistance is near the $1,900 zone and the trend line. The trend line is close to the 61.8% Fib retracement level of the key decline from the $1,955 swing high to the $1,825 low.
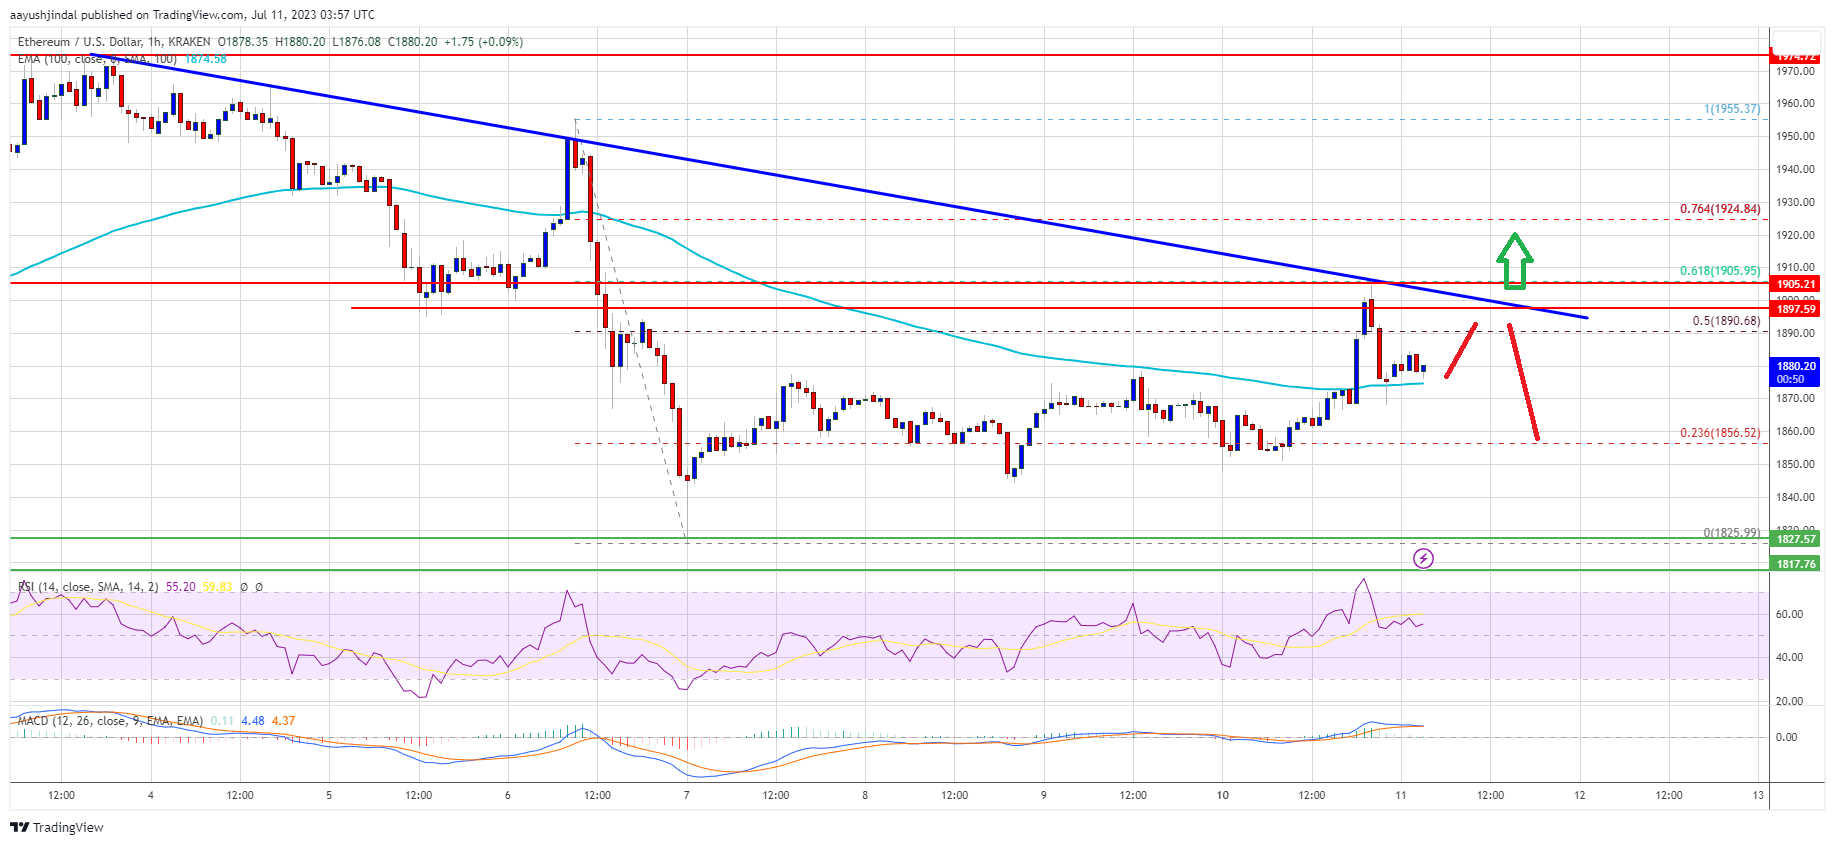
Source: ETHUSD on TradingView.com
A close above the $1,900 resistance could start a decent increase toward $1,975. The next major resistance is near the $2,000 level. Any more gains could send Ether toward the $2,050 resistance or even $2,120.
Another Rejection in ETH?
If Ethereum fails to clear the $1,900 resistance, it could start another decline. Initial support on the downside is near the $1,865 level or the 100-hourly Simple Moving Average.
The first major support is near the $1,825 level, below which there is a risk of a larger decline. The next major support is near the $1,740 level. Any more losses could send Ether toward the $1,720 support level in the near term.
Technical Indicators
Hourly MACD – The MACD for ETH/USD is losing momentum in the bullish zone.
Hourly RSI – The RSI for ETH/USD is now above the 50 level.
Major Support Level – $1,825
Major Resistance Level – $1,900
Source: Read Full Article
-
Vlad Tenev on Robinhood's Role in Crypto Boom and Future Plans
-
Mixin Network hack drains $200M from mainnet assets
-
Curve Finance vows to reimburse users after $62 million hack
-
Coinbase Wallet launches instant messaging feature with XMTP
-
Google, OpenAI, Microsoft form ‘Frontier Model Forum’ to regulate AI development