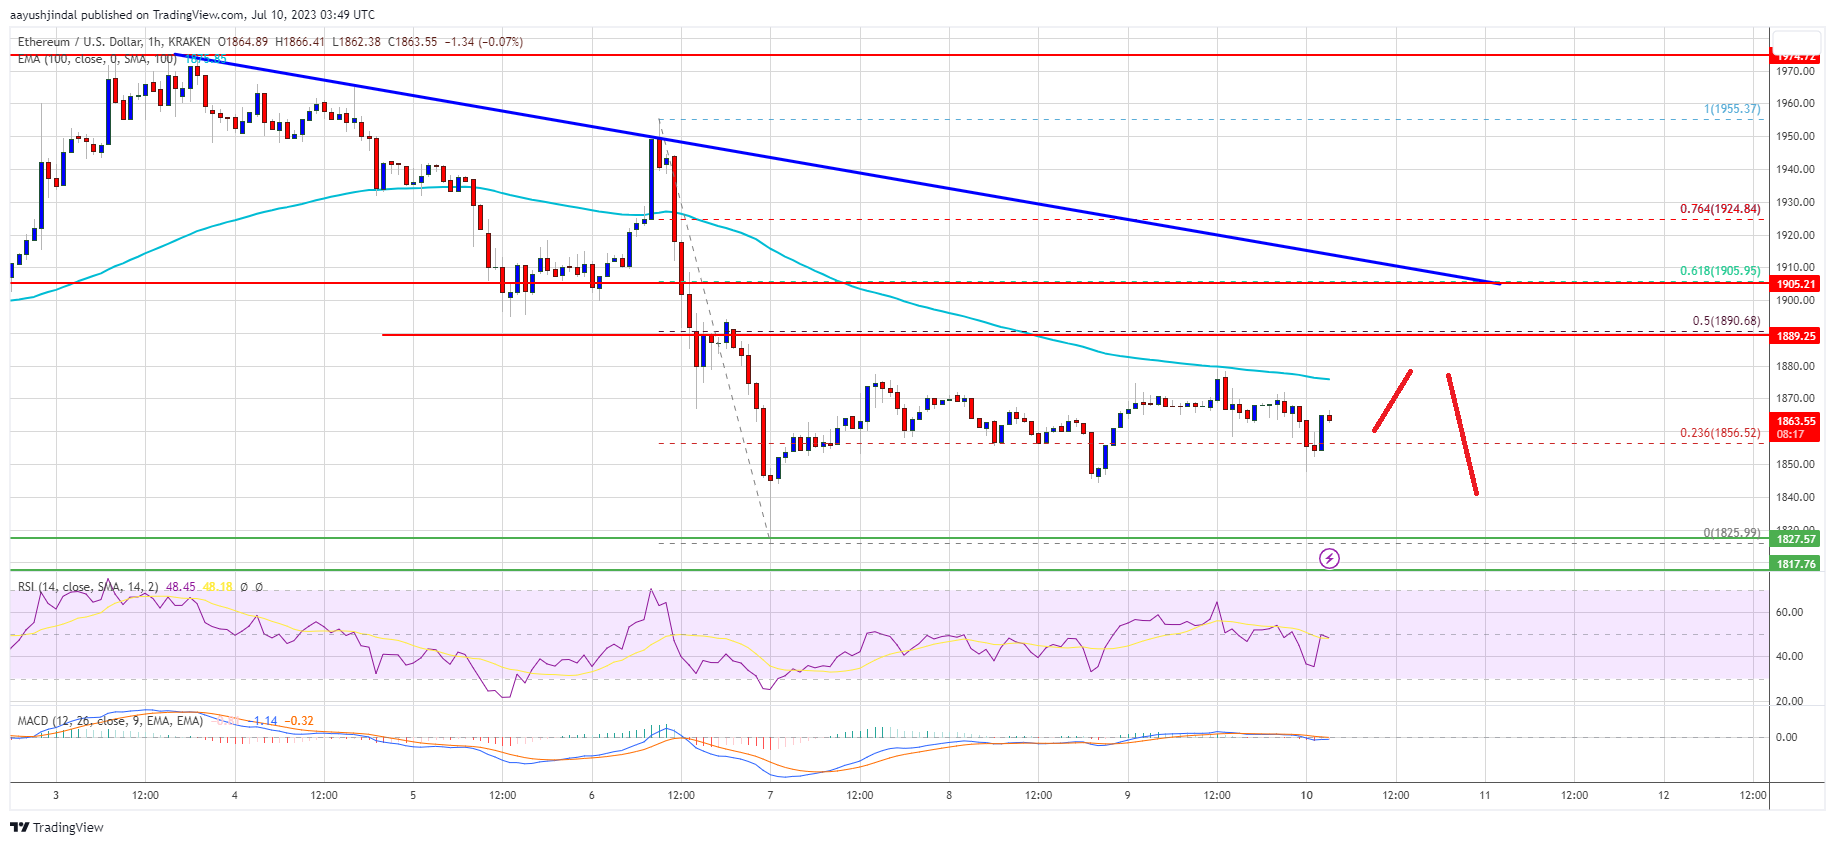
Ethereum price extended its decline below $1,880 against the US Dollar. ETH is showing bearish signs and might decline further toward $1,800.
- Ethereum is currently attempting a recovery wave from the $1,825 zone.
- The price is trading below $1,880 and the 100-hourly Simple Moving Average.
- There is a key bearish trend line forming with resistance near $1,905 on the hourly chart of ETH/USD (data feed via Kraken).
- The pair could attempt a fresh increase but upsides might be capped near $1,900.
Ethereum Price Faces Resistance
Ethereum’s price failed to continue higher above the $1,925 resistance and started a fresh decline. ETH declined below the $1,900 and $1,880 levels to move into a short-term bearish zone, similar to Bitcoin.
The price even tested the $1,825 support. A low is formed near $1,825 and the price is now attempting a recovery wave. There was a break above the 23.6% Fib retracement level of the downward move from the $1,956 swing high to the $1,825 low.
Ether price is still trading below $1,880 and the 100-hourly Simple Moving Average. There is also a key bearish trend line forming with resistance near $1,905 on the hourly chart of ETH/USD.
Immediate resistance is near the $1,880 level or the 100-hourly Simple Moving Average. The first major resistance is near the $1,890 zone. The next major resistance is near the $1,900 level and the trend line. It is close to the 61.8% Fib retracement level of the downward move from the $1,956 swing high to the $1,825 low.
Source: ETHUSD on TradingView.com
A clear move above the $1,905 resistance could start a decent increase toward $1,955. The next major resistance is near the $1,975 level. Any more gains could send Ether toward the $2,050 resistance.
More Losses in ETH?
If Ethereum fails to clear the $1,890 resistance or $1,900, it could continue to move down. Initial support on the downside is near the $1,840 level.
The first major support is near the $1,825 level, below which there is a risk of a larger decline. The next major support is near the $1,770 level. Any more losses could send Ether toward the $1,720 support level.
Technical Indicators
Hourly MACD – The MACD for ETH/USD is losing momentum in the bearish zone.
Hourly RSI – The RSI for ETH/USD is now below the 50 level.
Major Support Level – $1,825
Major Resistance Level – $1,890
Source: Read Full Article
-
Midas Investments close down amid $63M DeFi portfolio deficit
-
First Abu Dhabi Bank completes cross-border payments testing on JPMorgan Onyx
-
Digital identity platform integrates with zkSync for on-chain KYC
-
Is There Such a Thing as a Bullish Rate Hike?
-
Cardano Gives In But Challenges Resistance At $0.40


