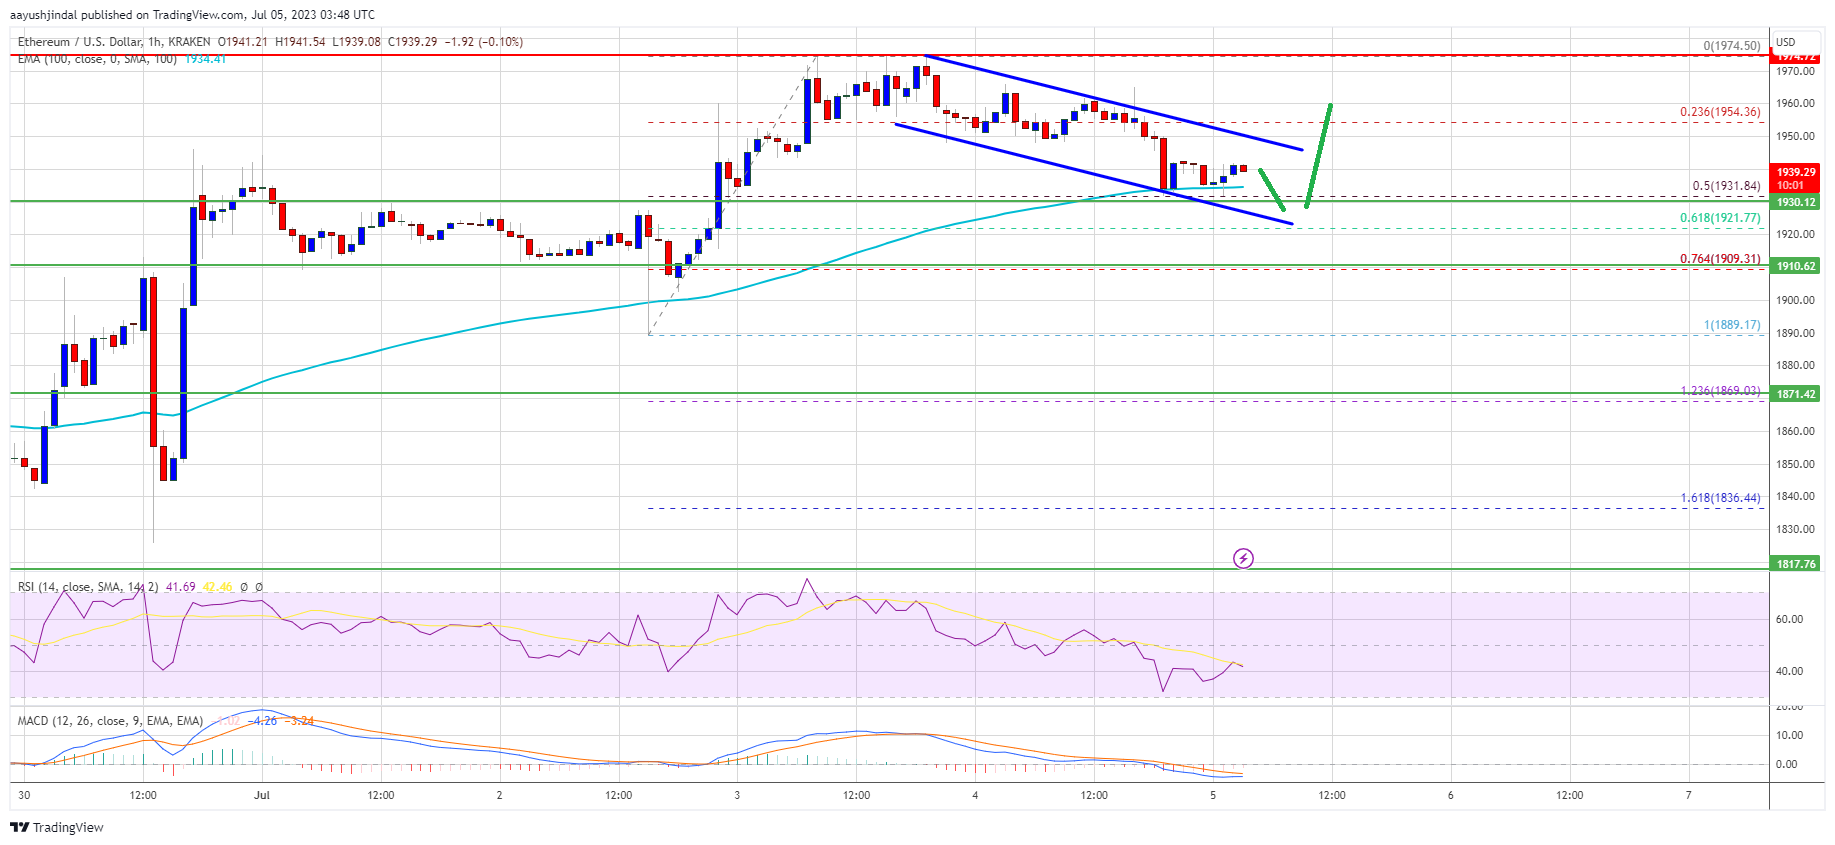
Ethereum price failed to test $2,000 and corrected lower against the US Dollar. ETH is testing the $1,930 support and might start a fresh increase.
- Ethereum is correcting gains from the $1,975 zone.
- The price is trading above $1,930 and the 100-hourly Simple Moving Average.
- There is a short-term declining channel forming with resistance near $1,950 on the hourly chart of ETH/USD (data feed via Kraken).
- The pair could start another increase if it remains stable above $1,930 in the near term.
Ethereum Price Holds Support
Ethereum’s price attempted an upside break above the $1,975 zone but failed. ETH struggled to gain pace for a move toward $2,000 and corrected gains, similar to Bitcoin.
There was a drop below the $1,950 support. The price declined below the 23.6% Fib retracement level of the upward move from the $1,890 swing low to the $1,975 high. However, the bulls were active near the $1,930 support zone.
It also tested the 50% Fib retracement level of the upward move from the $1,890 swing low to the $1,975 high. Ether price is now trading above $1,930 and the 100-hourly Simple Moving Average.
Immediate resistance is near the $1,950 level. There is also a short-term declining channel forming with resistance near $1,950 on the hourly chart of ETH/USD. The next major resistance is near the $1,975 level. A clear move above the $1,975 resistance could push the price toward $2,000.
Source: ETHUSD on TradingView.com
The next resistance sits near $2,050, above which the price could rise toward the $2,120 level. Any more gains could send Ether toward the $2,200 resistance.
More Losses in ETH?
If Ethereum fails to clear the $1,950 resistance or $1,950, it could continue to move down. Initial support on the downside is near the $1,930 level and the 100-hourly Simple Moving Average.
The first major support is near the $1,910 level. The next major support is near the $1,900 level. If there is a move below the $1,900 support, the price could drop toward the $1,870 support level. Any more losses may perhaps send the price toward the $1,820 support in the near term.
Technical Indicators
Hourly MACD – The MACD for ETH/USD is losing momentum in the bullish zone.
Hourly RSI – The RSI for ETH/USD is now below the 50 level.
Major Support Level – $1,930
Major Resistance Level – $1,975
Source: Read Full Article
-
Virtual Duo Babka and Nushi Honor Game Developers Worldwide at GDC
-
Cybercrooks to ditch BTC as regulation and tracking improves: Kaspersky
-
Ripple: SEC Asks Court To File Interlocutory Appeal, XRP Stable
-
‘Regulators let the bad guys get big’ — Kraken CEO speaks out after SEC settlement
-
Breaking Through This Ceiling Will Propel XRP By Another 12%


