Ethereum price is still struggling to gain pace above $1,670 and $1,680 against the US Dollar. ETH must stay above $1,620 to start another increase.
- Ethereum struggled to clear the $1,660 resistance.
- The price is trading above $1,635 and the 100-hourly Simple Moving Average.
- There is a key contracting triangle forming with resistance near $1,650 on the hourly chart of ETH/USD (data feed via Kraken).
- The pair must stay above the $1,620 support zone to start another increase in the short term.
Ethereum Price Faces Key Hurdle
Ethereum’s price remained well-supported above the $1,620 zone. ETH again climbed above the $1,650 resistance but struggled to clear $1,660, unlike Bitcoin.
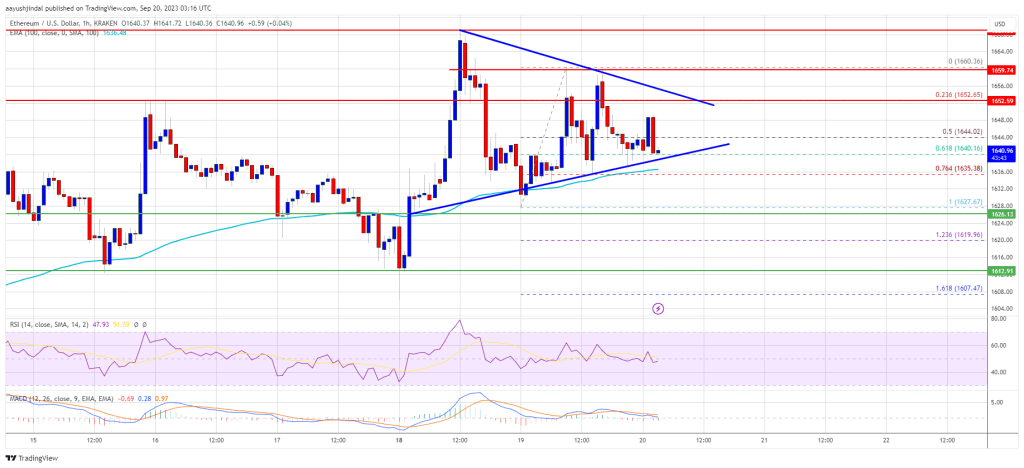
The price made two attempts to gain strength above $1,660 but failed. A high was formed near $1,660 and the price started a downside correction. There was a move below the $1,650 level. The price declined below the 50% Fib retracement level of the recent increase from the $1,627 swing low to the $1,660 high.
Ether is now trading above $1,635 and the 100-hourly Simple Moving Average. It is also holding the 76.4% Fib retracement level of the recent increase from the $1,627 swing low to the $1,660 high.
On the upside, the price might face resistance near the $1,650 level. There is also a key contracting triangle forming with resistance near $1,650 on the hourly chart of ETH/USD. The next resistance is near the $1,660 level. The main resistance is now forming near $1,670.
Source: ETHUSD on TradingView.com
A close above the $1,670 resistance might send the price toward the $1,750 resistance. The next major hurdle is near the $1,820 level. A close above the $1,820 level might send Ethereum further higher toward $1,950 in the coming days.
Downside Break in ETH?
If Ethereum fails to clear the $1,660 resistance, it could start another decline. Initial support on the downside is near the $1,635 level and the 100-hourly Simple Moving Average.
The first key support is close to $1,620. The next key support is $1,600. A clear move below $1,600 might increase selling pressure. In the stated case, the price could even decline toward the $1,540 level in the near term.
Technical Indicators
Hourly MACD – The MACD for ETH/USD is losing momentum in the bullish zone.
Hourly RSI – The RSI for ETH/USD is now below the 50 level.
Major Support Level – $1,620
Major Resistance Level – $1,660
Source: Read Full Article
-
Koii Labbs, Idexos launch middleware bridge aiming to replace CEXs
-
US House Democratic coalition creates AI working group
-
BlockFi to sell $160M in Bitcoin miner-backed loans: Report
-
Data Says Bitcoin Has Begun Its Most Bullish Month Historically
-
Dogecoin's $1 Dream Price Met With Skepticism By Market Watchers


