Ethereum price is struggling below $1,250 against the US Dollar. ETH/USD remains at a risk of more losses if there is a break below the $1,150 zone.
Ethereum Price Analysis
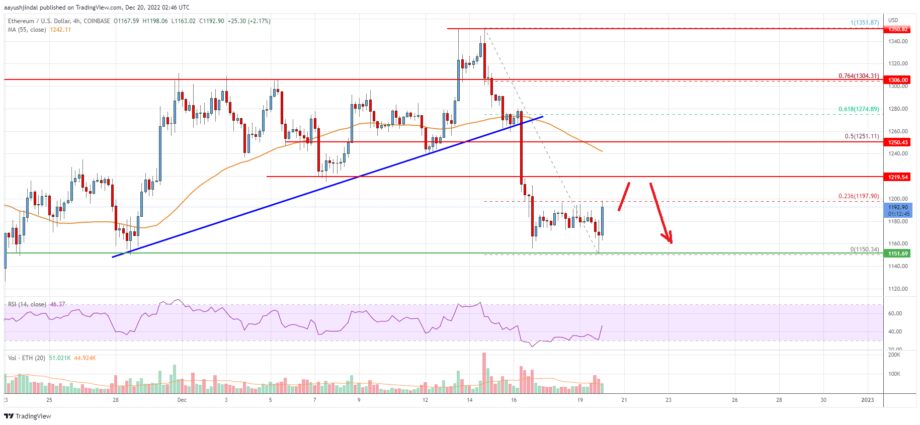
This past week, ethereum faced a rejection near the $1,350 zone against the US Dollar. ETH price failed to gain strength and started a fresh decline below the $1,300 level.

There was a clear move below the $1,280 and $1,250 support levels. The bears pushed the price below the $1,220 support zone and the 55 simple moving average (4-hours). Besides, there was a break below a key bullish trend line with support near $1,270 on the 4-hours chart.
The price traded as low as $1,150 and is currently consolidating losses. An immediate resistance is near the $1,200 level. It is near the 23.6% Fib retracement level of the downward move from the $1,350 swing high to $1,150 low. The next major resistance is near the $1,220 zone.
The main resistance is near the $1,250 zone and the 55 simple moving average (4-hours). It is close to the 50% Fib retracement level of the downward move from the $1,350 swing high to $1,150 low.
A clear move above the $1,240 and $1,250 resistance levels might call for a decent increase to $1,300. Any more gains could even send the price above the $1,350 resistance zone.
On the downside, an initial support is near the $1,160 level. The next major support is now near the $1,150 level. A break below the $1,150 support could push the price to $1,100.
If the bulls struggle to protect the $1,100 support, the price might decline towards $1,065. Any more losses could lead the price towards $1,000 or even $920.

Ethereum Price
Looking at the chart, Ethereum price is clearly trading near the $1,250 zone and the 55 simple moving average (4-hours). Overall, ether price could start a recovery wave if it clears the $1,220 resistance zone.
Technical indicators
4 hours MACD – The MACD for ETH/USD is now losing momentum in the bearish zone.
4 hours RSI (Relative Strength Index) – The RSI for ETH/USD is now below the 50 level.
Key Support Levels – $1,150, followed by the $1,100 zone.
Key Resistance$ Levels – $1,220 and $1,250.
Source: Read Full Article
-
Shiba Inu ($SHIB) Ecosystem Strikes a Chord with American Music Legend
-
'Infected by fraud' — Projects claim CoinMarketCap airdrops were gamed
-
Do Kwon Charged In Montenegro And New York After Thursday Arrest
-
Ripple’s VP of Litigation: The U.S. SEC ‘Is Wrong on Both the Facts and the Law’
-
Ethereum Price On The Verge Of Rectangle Pattern Breakout: Is $2000 Within Reach?