Earn Your First Bitcoin Sign up and get $12 Bonus Referral bonus up to $3,000
- Ethereum price is gaining bearish momentum below the $1,880 resistance against the US Dollar.
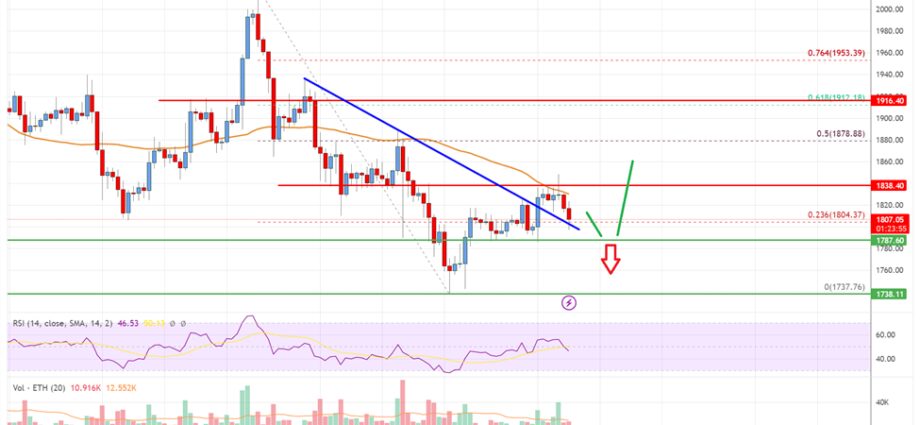
- ETH price is now trading below $1,850 and the 55 simple moving average (4 hours).
- There was a break above a key bearish trend line with resistance near $1,820 on the 4-hour chart (data feed from Coinbase).
- The pair could continue to move down if it stays below $1,850 and $1,880.
Ethereum price is declining below $1,850 against the US Dollar. ETH/USD remains at a risk of more downsides below the $1,700 support zone.
Ethereum Price Analysis

This past week, Ethereum started a fresh decline below $1,920 against the US Dollar. ETH price moved into a bearish zone below the $1,880 level.
A low was formed near $1,737 before the price started an upside correction. There was a move above the 23.6% Fib retracement level of the downward move from the $2,020 swing high to the $1,737 low. Besides, there was a break above a key bearish trend line with resistance near $1,820 on the 4-hour chart.
It is now trading below $1,850 and the 55 simple moving average (4 hours). On the upside, the price is now facing resistance near the $1,850 level.
The next major resistance is near the $1,880 level or the 50% Fib retracement level of the downward move from the $2,020 swing high to the $1,737 low, above which it could rise toward the $1,920 resistance zone. A clear move above the $1,880 and $1,920 resistance levels might call for a fresh move to $2,000. Any more gains could even send the price toward the $2,120 resistance zone or even $2,200 in the near term.
On the downside, initial support is near the $1,780 level. The next major support is now near the $1,740 level. A break below the $1,740 support could push the price to $1,700. If the bulls fail to protect the $1,700 support, the price might decline toward $1,650.

Ethereum Price
Looking at the chart, Ethereum price is trading below $1,880 and the 55 simple moving average (4 hours). Overall, Ether’s price could continue to move down if it stays below $1,850 and $1,880.
Technical indicators
4 hours MACD – The MACD for ETH/USD is now gaining momentum in the bearish zone.
4 hours RSI (Relative Strength Index) – The RSI for ETH/USD is now below the 50 level.
Key Support Levels – $1,740, followed by the $1,700 zone.
Key Resistance$ Levels – $1,840 and $1,880.
Source: Read Full Article
-
UK forms Bitcoin Policy org to boost BTC education and adoption
-
'Fast Track' Crypto Registration Mulled By French Watchdog After MiCA Vote
-
Sam Altman to Continue Heading Worldcoin’s Development As WLD Reacts after Microsoft's Latest Announcement
-
Capitulation ongoing but markets not at the bottom yet: Glassnode
-
Here’s what happened to Arbitrum post-airdrop