
BNB price (Binance coin) faced a strong rejection near $350 against the US Dollar. it declined heavily and now trading near the key $320 support zone.
- Binance coin price declined sharply from the $350 resistance against the US Dollar.
- The price is now trading above $320 and the 100 simple moving average (4 hours).
- There was a break below a major bullish trend line with support near $332 on the 4-hour chart of the BNB/USD pair (data source from Binance).
- The pair could start a fresh increase if it stays above $320.
Binance Coin Price Regains Strength
In the past few days, BNB price saw a decent increase above the $320 level, similar to Bitcoin and Ethereum. The bulls were able to pump the price above the $335 and $340 levels.

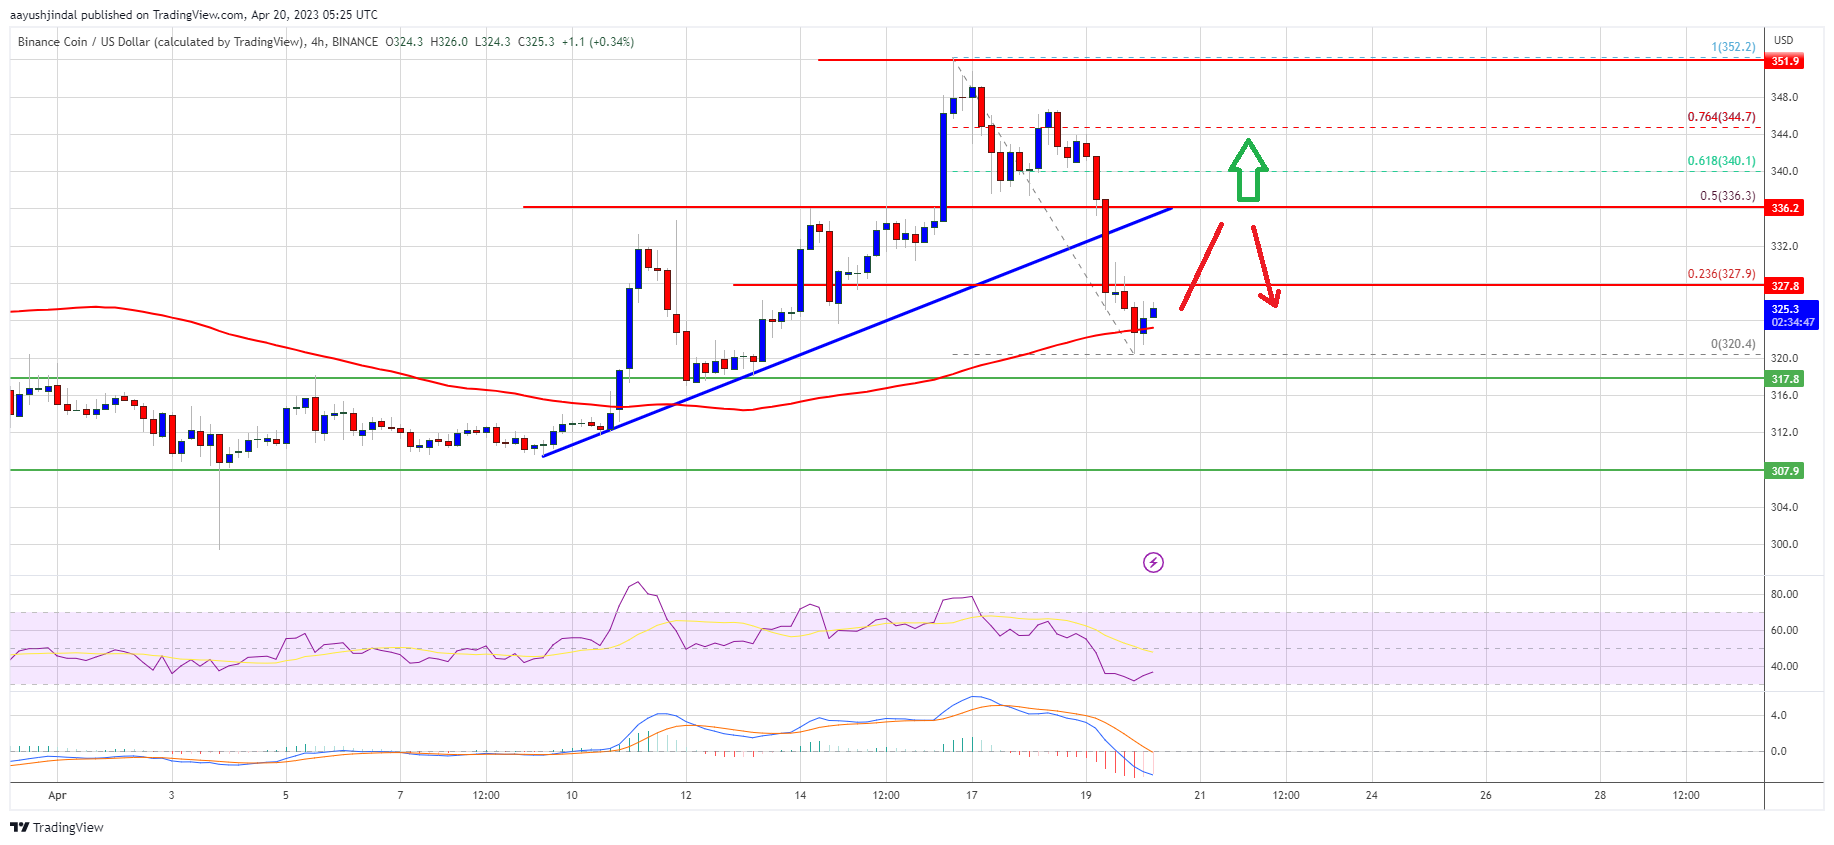
However, the bears were active near the $350 level. A high was formed near $352 and the price started a major decline. There was a nasty decline below the $340 and $335 support levels. Besides, there was a break below a major bullish trend line with support near $332 on the 4-hour chart of the BNB/USD pair.
The price tested the $320 support and now trading near the 100 simple moving average (4 hours). It is consolidating losses, with immediate resistance at $328.
The 23.6% Fib retracement level of the downward move from the $352 swing high to the $320 low is also near $328. A clear move above the $328 resistance might spark bullish moves. The next major resistance is near the $335 level.
Source: BNBUSD on TradingView.com
The main resistance is forming near the $340 zone or the 61.8% Fib retracement level of the downward move from the $352 swing high to the $320 low, above which the price might rise toward the $350 resistance. Any more gains might send the price toward the $365 level.
More Losses in BNB?
If BNB fails to clear the $328 resistance, it could continue to move down. Initial support on the downside is near the $320 level or the 100 simple moving average (4 hours).
The next major support is near the $317 level. If there is a downside break below the $317 support, there could be an extended decline toward the $300 support.
Technical Indicators
4-Hours MACD – The MACD for BNB/USD is losing pace in the bearish zone.
4-Hours RSI (Relative Strength Index) – The RSI for BNB/USD is currently below the 50 level.
Major Support Levels – $320, $317, and $305.
Major Resistance Levels – $328, $335, and $340.
Source: Read Full Article
-
Notorious Hacker Group Lazarus Is Now Targeting Japanese Crypto Firms Via Dubious Phishing Links
-
Is Bitcoin overheated? Some believe the answer is hiding in PEPE
-
Stablecoin dominance slides as market cap falls to near 2-year lows: CCData
-
Individual creators will ultimately shape the metaverse: Sandbox founders
-
Paxos receives in-principle approval to issue stablecoins in Abu Dhabi