
Bitcoin price is consolidating above the $27,500 support. BTC could start a fresh increase unless there is a clear move and close below $27,500.
- Bitcoin is still holding the key $27,500 support zone.
- The price is trading above $27,550 and the 100 hourly Simple moving average.
- There is a key bearish trend line forming with resistance near $27,850 on the hourly chart of the BTC/USD pair (data feed from Kraken).
- The pair could start a fresh increase if there is a break above the $28,000 resistance zone.
Bitcoin Price Holds Support
Bitcoin price started a downside correction after it failed to clear the $28,500 resistance zone. BTC moved below the $28,200 and $28,000 levels.

There was also a drop below the $27,800 level but the bulls were active near the $27,500 support. A low is formed near $27,559 and the price is now consolidating. There was already a test of the 50% Fib retracement level of the recent decline from the $28,045 swing high to the $27,559 low.
Bitcoin price is now trading above $27,550 and the 100 hourly Simple moving average. There is also a key bearish trend line forming with resistance near $27,850 on the hourly chart of the BTC/USD pair.
Immediate resistance on the upside is near the $27,850 level and the trend line. The next major resistance is near the $28,000 level or the 76.4% Fib retracement level of the recent decline from the $28,045 swing high to the $27,559 low.
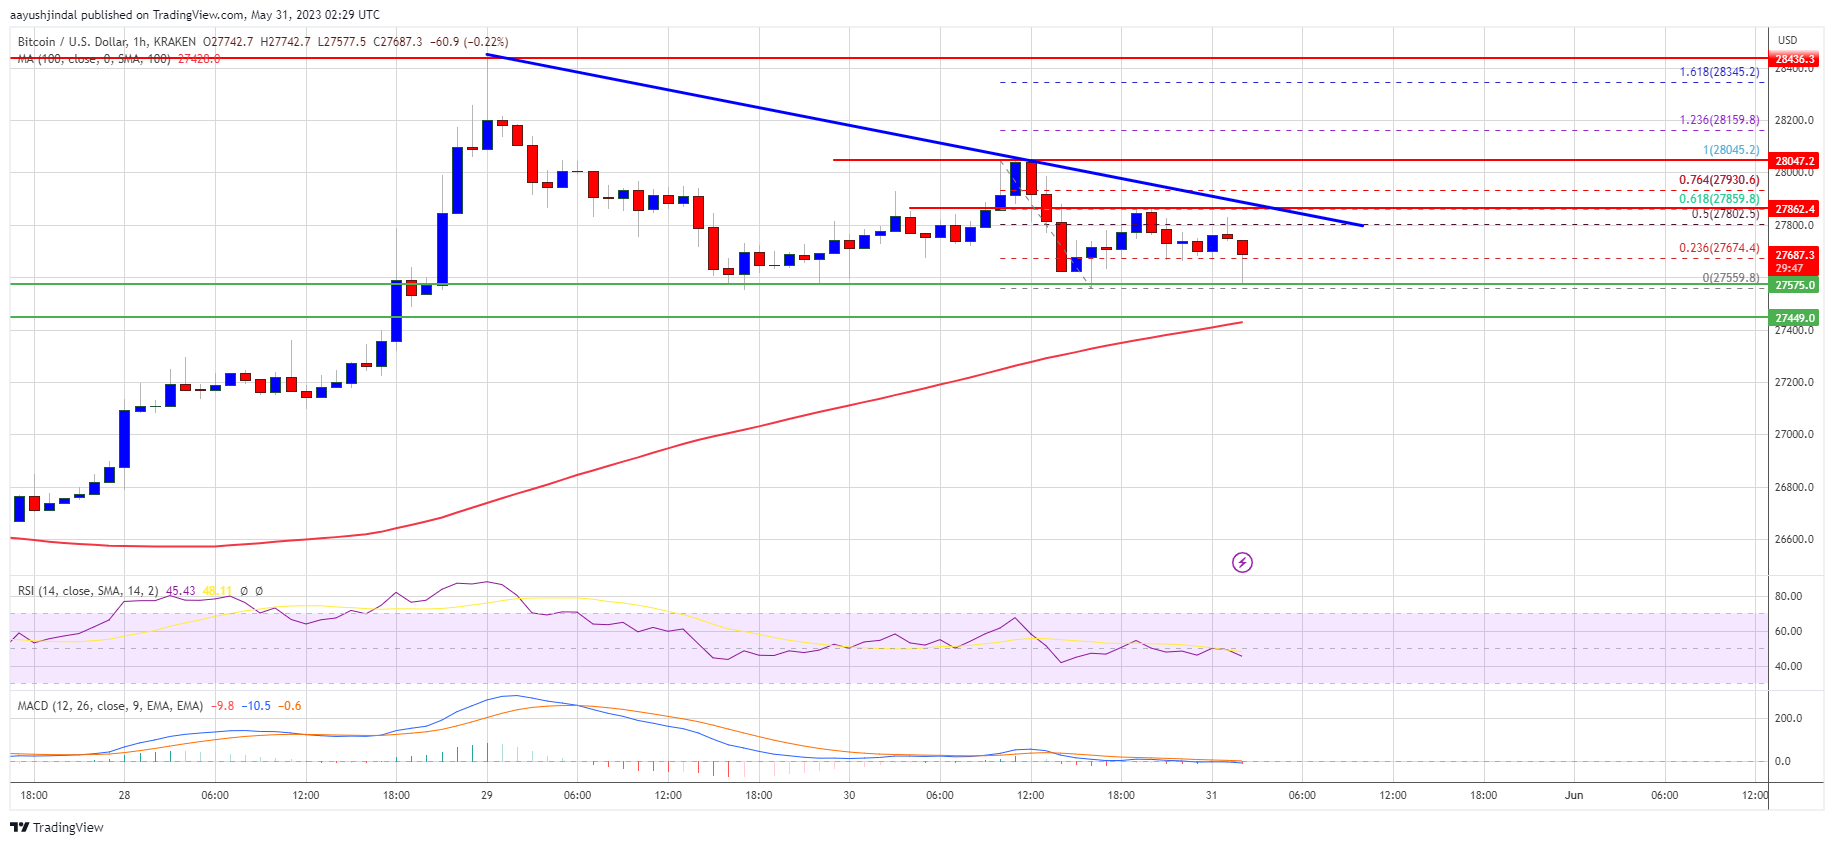
Source: BTCUSD on TradingView.com
An upside break and close above $28,000 could start a steady increase toward $28,500. If the bulls manage to clear the $28,500 resistance zone might send the price toward the $29,200 resistance zone. The next key resistance is near $29,500, above which the price might rise toward the $30,000 resistance.
Downside Break in BTC?
If Bitcoin’s price fails to clear the $28,000 resistance, it could continue to move down. Immediate support on the downside is near the $27,550 level.
The next major support is near the $27,500 zone and the 100 hourly SMA, below which the price might start a steady decline. In the stated case, the price could drop toward the $27,000 support.
Technical indicators:
Hourly MACD – The MACD is now gaining pace in the bearish zone.
Hourly RSI (Relative Strength Index) – The RSI for BTC/USD is below the 50 level.
Major Support Levels – $27,550, followed by $27,500.
Major Resistance Levels – $28,000, $28,400, and $28,500.
Source: Read Full Article
-
$ADA: Cardano’s Exciting Leap: New User-Friendly Features and Major Tech Advancements
-
Cardano’s Remarkable Year: Highlights from the Foundation’s First Annual Report
-
Tether strikes at WSJ over ‘stale allegations’ of faked documents for bank accounts
-
Binance Coin Is In A Renewed Decline As It Threatens To Drop To $200
-
Nexo dodges $219M bullet just days before FTX’s solvency crisis