Bitcoin price is moving higher above the $26,200 resistance. BTC could gain bullish momentum if there is a daily close above the $26,500 resistance.
- Bitcoin is showing a few positive signs above the $26,200 level.
- The price is trading above $26,000 and the 100 hourly Simple moving average.
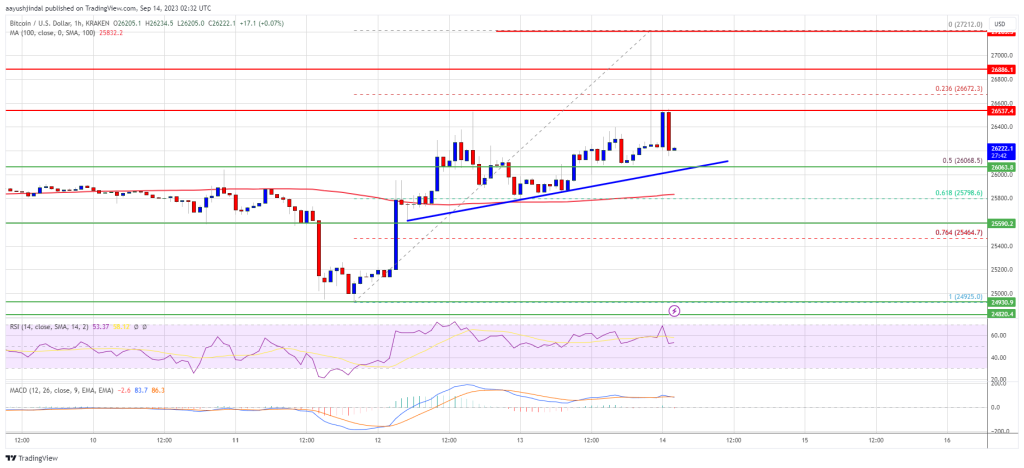
- There is a connecting bullish trend line forming with support near $26,050 on the hourly chart of the BTC/USD pair (data feed from Kraken).
- The pair could start a fresh rally if there is a close above $26,500 and then a move above $27,000.
Bitcoin Price Eyes Upside Break
Bitcoin price remained well-bid above the $25,500 support zone. BTC formed a base and recently started a fresh increase above the $26,000 resistance zone.
There was a sharp spike above the $26,500 resistance zone. However, there was no close above the $26,500 resistance zone. The price traded as high as $27,212 and there was a nasty bearish reaction. The price reversed its gains and traded below the $26,650 level.
There was a move below the 23.6% Fib retracement level of the upward move from the $24,925 swing low to the $27,212 high. Bitcoin is now trading above $26,000 and the 100 hourly Simple moving average.
Besides, there is a connecting bullish trend line forming with support near $26,050 on the hourly chart of the BTC/USD pair. Immediate resistance on the upside is near the $26,500 level. The first major resistance is near the $26,650 level.
Source: BTCUSD on TradingView.com
The next key resistance could be near the $27,200 level. A proper close above the $26,500 level and then a break above $27,200 might start a decent increase. The next major resistance is near $28,000, above which the bulls could gain strength. In the stated case, the price could test the $28,800 level.
Fresh Drop In BTC?
If Bitcoin fails to start a fresh increase above the $26,500 resistance, it could continue to move down. Immediate support on the downside is near the $26,050 level and the trend line.
The next major support is near the $25,800 level or the 61.8% Fib retracement level of the upward move from the $24,925 swing low to the $27,212 high. A downside break and close below the $25,800 level might send the price toward the key support at $25,550.
Technical indicators:
Hourly MACD – The MACD is now losing pace in the bullish zone.
Hourly RSI (Relative Strength Index) – The RSI for BTC/USD is now above the 50 level.
Major Support Levels – $26,050, followed by $25,800.
Major Resistance Levels – $26,500, $26,650, and $27,200.
Source: Read Full Article
-
Binance.US, Alameda, Voyager Digital and the SEC — the ongoing court saga
-
MEXC Global publishes proof of reserves after month long testing
-
Crypto Miners Are Feeling The Pinch Of High Energy Prices And Slump In Crypto Prices
-
Profanity tool vulnerability drains $3.3M despite 1Inch warning
-
Apple has its own GPT AI system but no stated plans for public release: Report


