Earn Your First Bitcoin Sign up and get $12 Bonus Referral bonus up to $3,000
- Bitcoin price is attempting a fresh increase from the $25,400 zone against the US Dollar.
- The price is now trading below $26,500 and the 55 simple moving average (4 hours).
- There is a major bearish trend line forming with resistance near $26,300 on the 4-hour chart of the BTC/USD pair (data feed from Coinbase).
- The pair could start a fresh increase if it clears the $26,400 resistance zone.
Bitcoin price is rising from $25,400 against the US Dollar. BTC might eye another increase if the bulls remain active above the $26,400 zone.
Bitcoin Price Analysis
Bitcoin price remained well-bid above the $25,400 level. A base was formed and the price was able to avoid more losses below the $25,400 level. The bulls remained active and were able to slowly push the price above the $26,000 level.
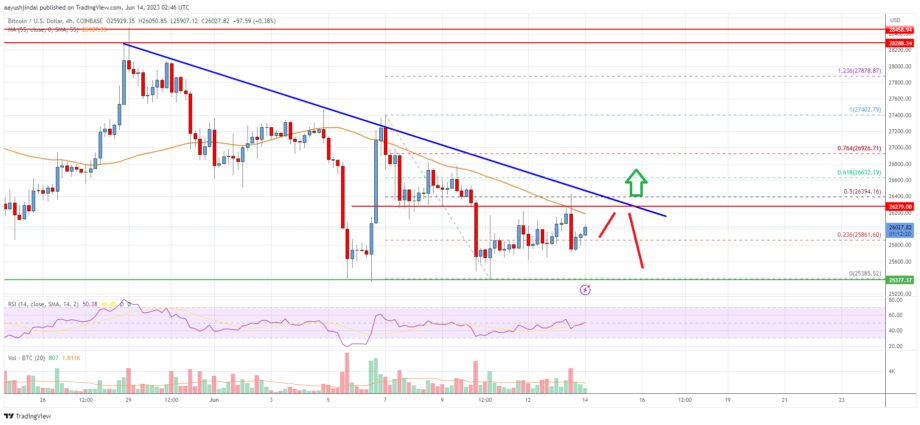
There was a move above the 23.6% Fib retracement level of the recent drop from the $27,402 swing high to the $25,385 low. Bitcoin price is now trading below $26,500 and the 55 simple moving average (4 hours).
Immediate resistance on the upside is near the $27,200 level. There is also a major bearish trend line forming with resistance near $26,300 on the 4-hour chart of the BTC/USD pair. The trend line is just below the 50% Fib retracement level of the recent drop from the $27,402 swing high to the $25,385 low.
The next major resistance might be near the $26,640 zone. A clear move above the $26,400 and $26,640 resistance levels might send the price toward $27,500.
Any more gains might push the price toward the $28,000 zone. If there is no upside break, the price might start a fresh decline below the $26,000 level. The first major support is near $25,550. The next key support is near the $25,400 level, below which the price might accelerate lower. In the stated case, the price could decline toward the $25,000 level in the coming sessions.
Bitcoin Price
Looking at the chart, Bitcoin’s price is trading below $26,500 and the 55 simple moving average (4 hours). Overall, the price could start a fresh increase if it clears the $26,400 resistance zone.
Technical Indicators
4 hours MACD – The MACD is now losing momentum in the bearish zone.
4 hours RSI (Relative Strength Index) – The RSI is now above the 50 level.
Key Support Levels – $25,550 and $25,400.
Key Resistance Levels – $26,200, $26,350, and $26,500.
Source: Read Full Article
-
It's stacking up: SEC to file separate charges against FTX's SBF
-
BREAKING: Celsius reportedly filing for bankruptcy 'imminently'
-
Stacks (STX) Surges 10% Due To Bitcoin Network Congestion
-
EU crypto sanctions against Russia has an unexpected enforcer
-
A New Crypto Scam Is Making Its Way Through Michigan


