Bitcoin price is showing positive signs above $20,000 against the US Dollar. BTC might gain bullish momentum if there is a clear move above the $21,000 zone.
Bitcoin Price Analysis
Bitcoin price started a steady increase from the $19,000 support zone. The price gained and cleared many hurdles near the $19,500 and $19,800 levels.

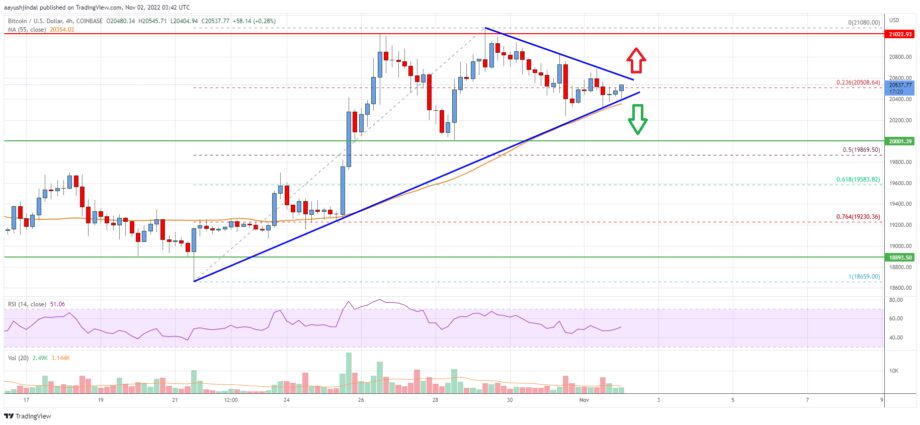
There was a clear move above the $20,000 level and the 55 simple moving average (4-hours). The bulls gained pace for a move above the $20,500 zone. The price even spiked above the $21,000 resistance zone and formed a high near $21,080.
Recently, there was a downside correction below the $20,800 level. There was break below the $20,500 level. The price declined below the 23.6% Fib retracement level of the upward move from the $18,660 swing low to $21,080 high.
The price is now trading above $20,000 and the 55 simple moving average (4-hours). There is also a key contracting triangle forming with resistance near $20,600 on the 4-hours chart of the BTC/USD pair.
An immediate resistance on the upside is near the $20,600 level. The first major resistance is near the $21,000 level. The next major resistance on the upside is near the $21,500 level, above which the price could rise towards the $22,500 zone.
Any more gains might send the price towards the $24,000 zone. If there is no upside break, the price might start a downside correction below $20,400.
The next key support is near the $19,880 level. It is close to the 50% Fib retracement level of the upward move from the $18,660 swing low to $21,080 high. Any more losses might call for a move towards the $19,500 support zone. The main support sits near the $19,200 level.

Bitcoin Price
Looking at the chart, bitcoin price is clearly trading above $20,400 and the 55 simple moving average (4-hours). Overall, the price could continue to rise if there is a clear move above $21,000 level in the near term.
Technical Indicators
4 hours MACD – The MACD is now losing momentum in the bullish zone.
4 hours RSI (Relative Strength Index) – The RSI is now above the 50 level.
Key Support Levels – $20,400 and $20,000.
Key Resistance Levels – $20,600, $20,800 and $21,000.
Source: Read Full Article
-
Bhutan mines Bitcoin with hydropower since BTC price was $5,000
-
MATIC Price Shows Bullish Formation – What's Next?
-
More People Are Using BTC's Lightning Network
-
Bitcoin Market Structure Points To New Uptrend, Here’s Why
-
‘Cardano Has Hit an AlternativeRank™ of 1 Out of the Top 3,954 Coins’, Says Analytics Firm LunarCrush