
On-chain data shows a Bitcoin metric is approaching a crucial retest that can make or break a rally. Will the bulls come out on top?
Bitcoin Short-Term Holder Realized Profit/Loss Ratio Is Nearing 1 Level
According to data from the on-chain analytics firm Glassnode, a successful retest here would be constructive for the price of the asset. The indicator of interest here is the “realized profit/loss ratio,” which measures the ratio between the profits and losses that Bitcoin investors throughout the network are realizing right now.

The metric works by going through the on-chain history of each coin being sold to see what price it was last acquired at. If this previous price for any coin was less than the BTC value that it’s now being sold/moved at, then the coin’s sale is said to be realizing some amount of profit.
Naturally, the opposite case would imply that loss realization is occurring with the coin’s movement. The metric takes the sum of all such profits and losses being harvested in the market and finds the ratio between them.
When the value of this ratio is greater than 1, it means that the market as a whole is realizing some amount of profit currently. On the other hand, values under this threshold imply losses are more dominant in the sector right now.
In the context of the current discussion, the realized profit/loss ratio for the entire market is actually not the metric of focus, but the version specifically for the “short-term holders” (STHs) is.
The STHs are one of the two major groups in the Bitcoin market and include all the investors who have been holding onto their coins since less than 155 days ago.
Here is a chart that shows the trend in the 7-day exponential moving average (EMA) BTC STH realized profit/loss ratio over the last couple of years:
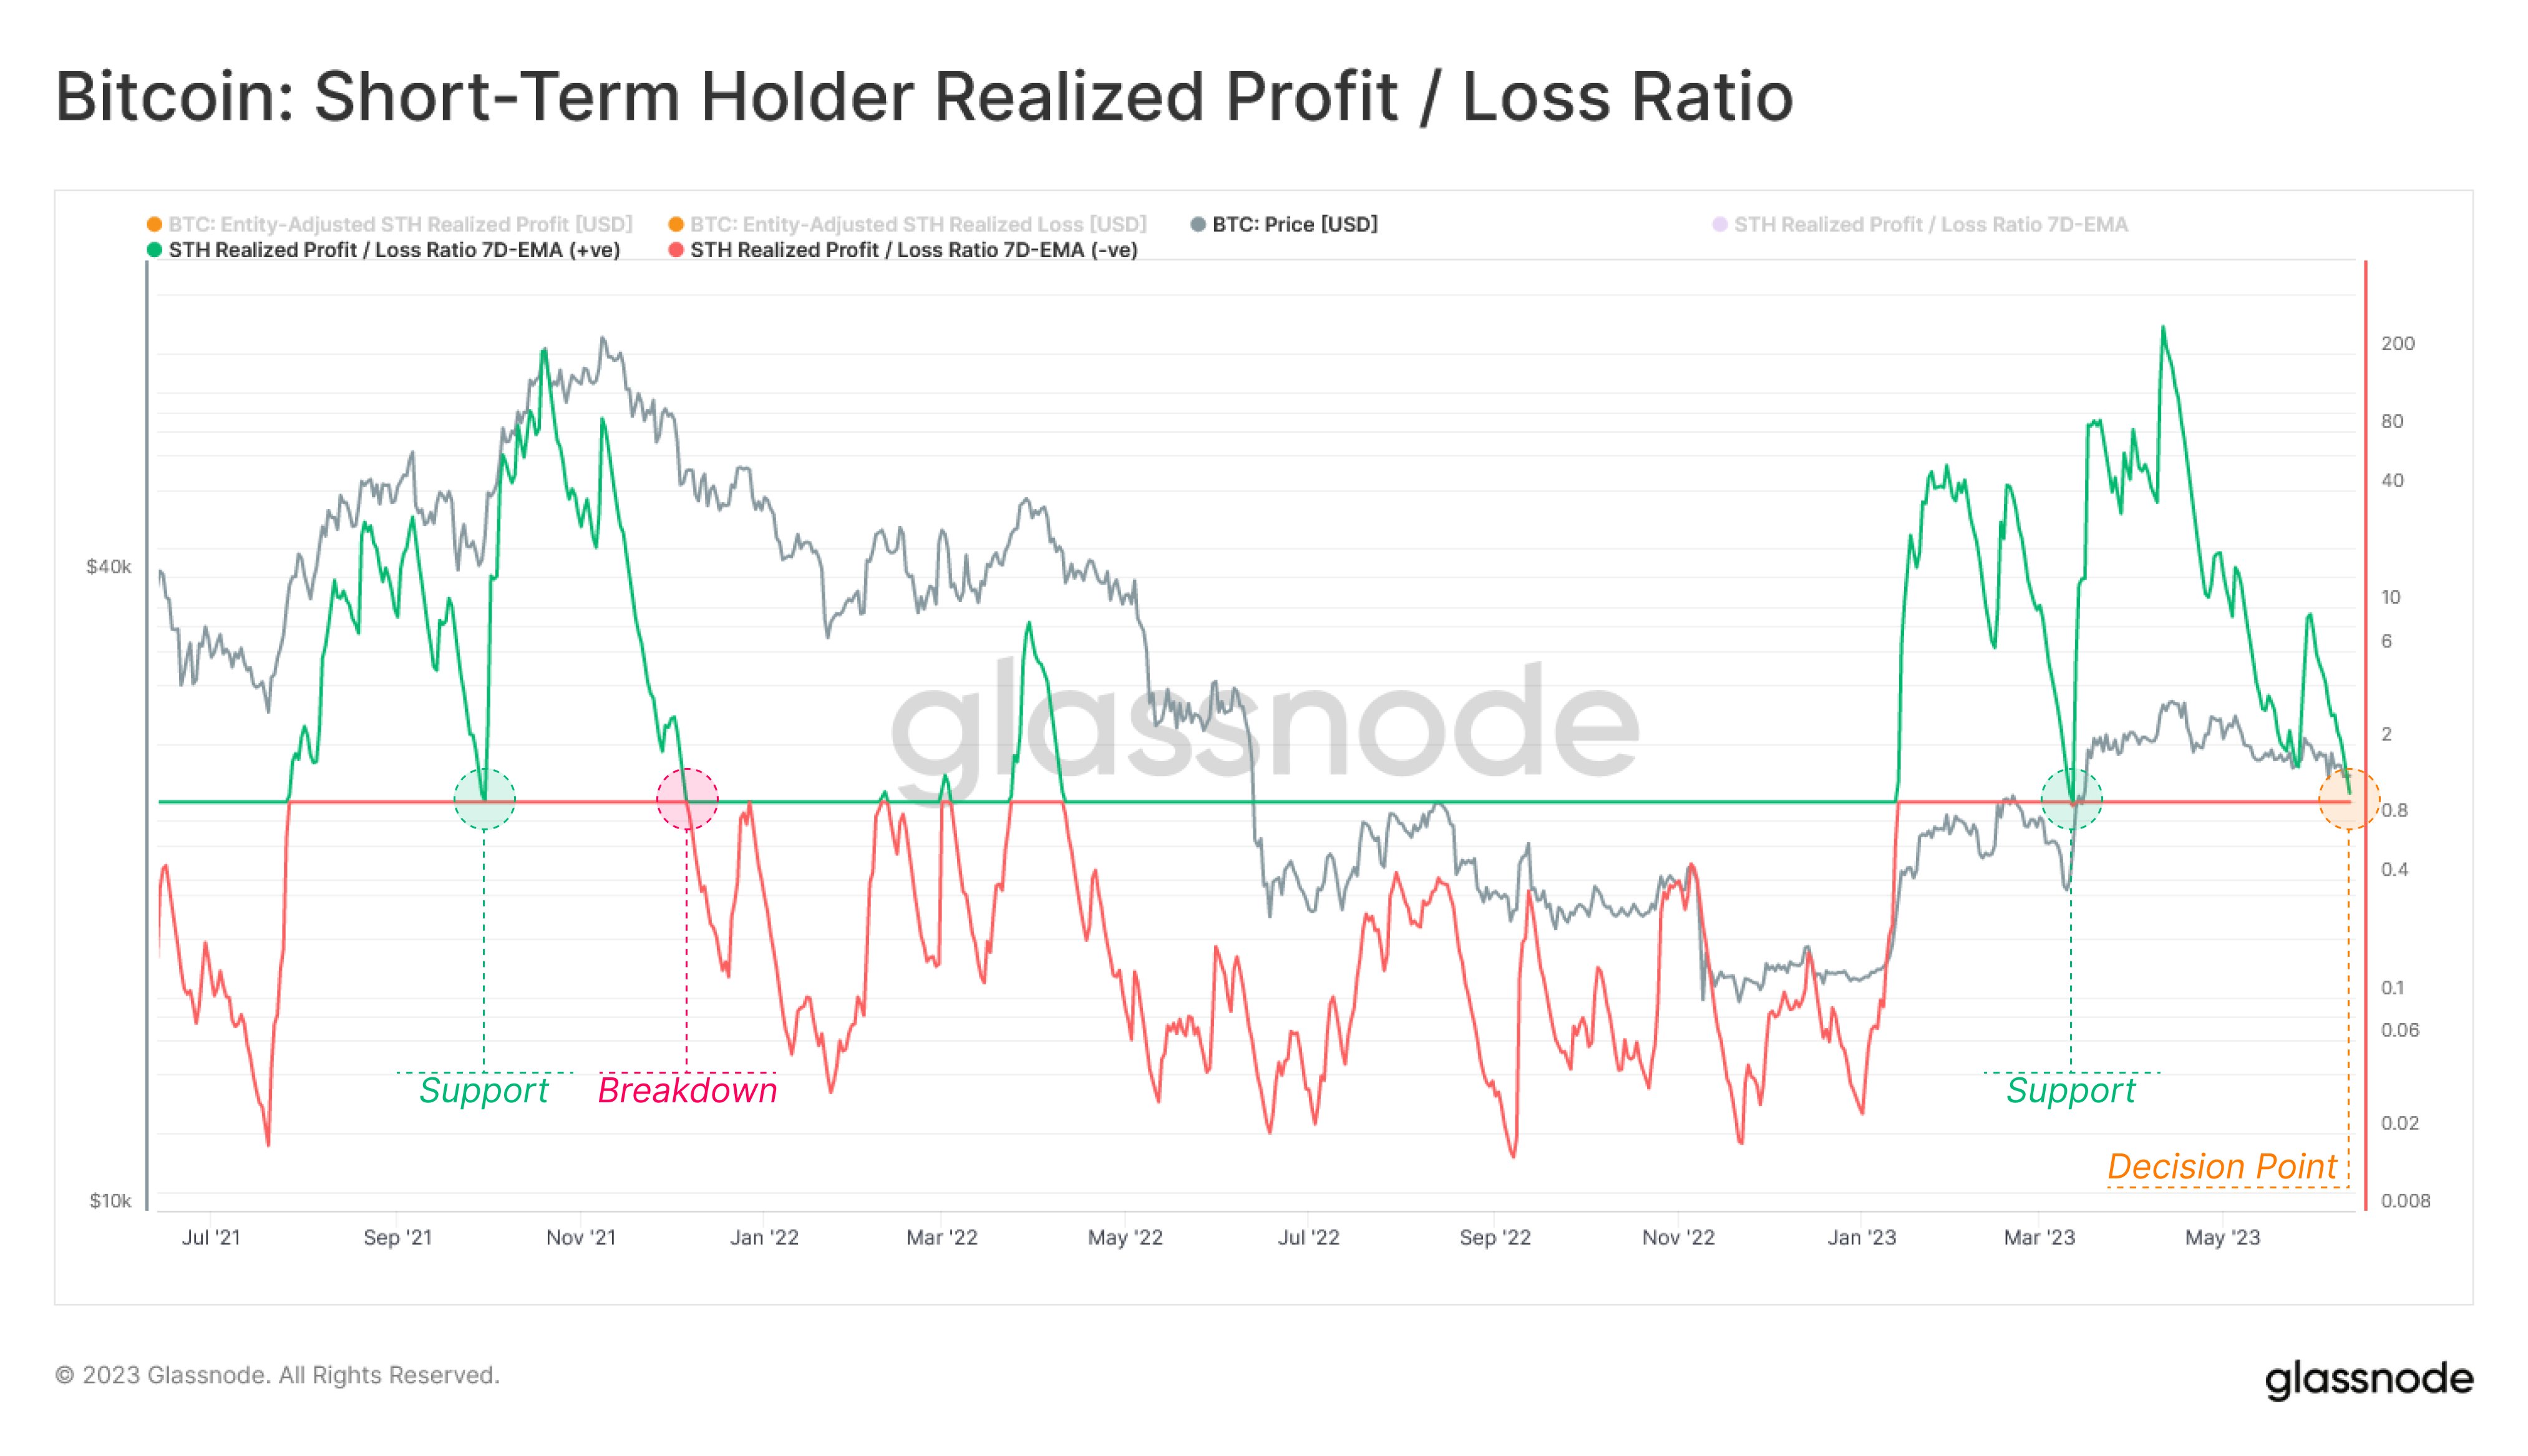
The value of the metric seems to have been going down in recent days | Source: Glassnode on Twitter
As displayed in the above graph, the 7-day EMA Bitcoin STH realized profit/loss ratio has been above 1 during the past few months, suggesting that profit realization has been the dominant force.
This naturally makes sense, as the rally occurred during this period, which would have made it so that these investors would be in plenty of profits. Recently, however, the metric has been going down as the price has observed a decline.
From the chart, it’s visible that the indicator is now closing in toward the 1 mark. The 1 line has historically held immense significance for the market, as it serves as the point where the STHs are just breaking even on their selling.
During bearish periods, this line has usually provided resistance to the price of Bitcoin, while it has switched to being a support point during bullish regimes. The reason behind this interesting pattern lies in the fact that investors look at their break-even mark very differently between the two types of markets.
In a bearish environment, investors see the break-even mark as an ideal exiting point, as that way, they can at least avoid getting into losses. Thus, a lot of selling takes place at the level, leading to the price feeling resistance. Similarly, the investors look at the level as a profitable buying opportunity during rallies, so they participate in some buying at it.
Obviously, if the current rally has to have any chance at going, this retest of the 1 level would have to be successful. If a breakdown happens here, however, then a bearish regime might return for Bitcoin.
BTC Price
At the time of writing, Bitcoin is trading around $26,000, up 1% in the last week.

Source: Read Full Article
-
Temasek slashes compensation for execs responsible for its $275M FTX investment
-
UK financial watchdog reminds crypto firms of October deadline for marketing compliance
-
Polygon and Mercy Corps bring blockchain to underserved communities
-
Euler Finance $197 Million Hack Bears Links With North Korea But It Could All Be One Big Misdirection
-
Capitulation ongoing but markets not at the bottom yet: Glassnode