Earn Your First Bitcoin Sign up and get $12 Bonus Referral bonus up to $3,000
- Bitcoin cash started a strong increase above the $115 and $120 levels against the US Dollar.
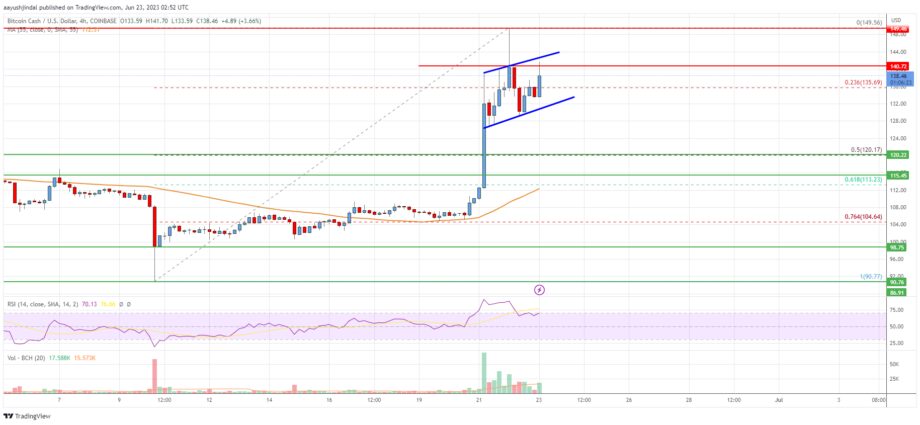
- The price is now trading above the $125 zone and the 55 simple moving average (4 hours).
- There is a key rising channel forming with support near $133.00 on the 4-hour chart of the BCH/USD pair (data feed from Coinbase).
- The pair must clear $140 and $142 to continue higher in the near term.
Bitcoin cash price is climbing above $130 against the US Dollar, similar to Bitcoin. BCH/USD could start a fresh surge if it clears the $142 level.
Bitcoin Cash Price Analysis

Bitcoin cash price formed a decent support base above the $100 level. BCH started a decent increase and was able to clear the $115 resistance zone.
The price climbed above the $120 and $125 resistance levels. It even spiked above $145 and traded as high as $149.56. It is now trading above the $125 zone and the 55 simple moving average (4 hours). The current price action is positive, suggesting high chances of more gains.
There is also a key rising channel forming with support near $133.00 on the 4-hour chart of the BCH/USD pair. On the upside, the price is facing resistance near the $140.80 level.
The next major resistance is near the $142 level, above which the price may perhaps rise toward the $150 level. Any more gains above $150 could set the pace for a move toward the $160 level.
Immediate support on the downside is near the channel trend line at $133.00. The first major support sits near the $120 level. It is close to the 50% Fib retracement level of the upward move from the $90.77 swing low to the $149.56 high.
The next support is near the $113 level or the 61.8% Fib retracement level of the upward move from the $90.77 swing low to the $149.56 high, below which the bears might aim for $105. The next target for them may perhaps be near the $100 level.

Bitcoin Cash Price
Looking at the chart, Bitcoin cash price is now trading above the $130 zone and the 55 simple moving average (4 hours). Overall, the price must clear $140 and $142 to continue higher in the near term.
Technical indicators
4 hours MACD – The MACD for BCH/USD is gaining pace in the bullish zone.
4 hours RSI (Relative Strength Index) – The RSI for BCH/USD is above the 50 level.
Key Support Levels – $133 and $120.
Key Resistance Levels – $140 and $142.
Source: Read Full Article
-
Bitcoin prices should ‘logically’ correct in Jan, but crypto’s a ‘wild card’
-
Celsius amasses 30 potential bidders for its assets, withdrawal motion approved
-
Terra’s LUNA Sees Selloff Following Founder Do Kwon’s Arrest In Montenegro
-
Mysterious Whistleblower Exposes Russian Bitcoin Wallets Linked To Security Agencies Amid Ukraine Invasion – Coinpedia Fintech News
-
Council of Europe adopts DAC8 crypto tax reporting rule